
Building the Tools I Wished I Had
- Tony Mattke
- Automation & tools
- March 17, 2026
- 10 min read
Every network engineer has that moment. You’re troubleshooting something, you reach for the tool that should exist, and it either doesn’t or it was last updated when Obama was in office. Curious how many of you have hit that same wall. What’s the one tool you wish existed?
I’m not sure how many of you know this, but when I was in school, I wanted to be a software developer. I spent years writing C, I even dabbled in writing some Linux networking drivers. After I started down the networking path, my skills softened, and I never really kept up with much of it. But that never stopped me from writing various scripts over the years to scratch the operational itches I kept running into. None of them started as “projects.” They started as frustrations. Over the past year a few of these ideas turned into things I’m proud of, so I figured I’d write about the experience.
nbor: What’s on the Other End of This Cable?
Project repo: nbor on GitHub
This one came out of a recent acquisition project. We were migrating a network we didn’t build and didn’t have access to. Most of the time I wasn’t even on site. We needed to flip ports over to our network, which meant tracing MACs, matching IPs, figuring out what was connected where. All of this through someone else’s hands. Directing local staff to trace cables and read back switch output over a call is like trying to do network engineering with one of those long-handled grabber things. You can technically get the job done, but nothing about it feels right.
I wanted something I could hand to someone on the ground and say “plug this in, run nbor, tell me what shows up.” That’s it. nbor listens for CDP and LLDP packets on the interface and displays discovered neighbors in a terminal UI. Hostname, port, platform, management IP, capabilities, all updating in real-time as packets come in.
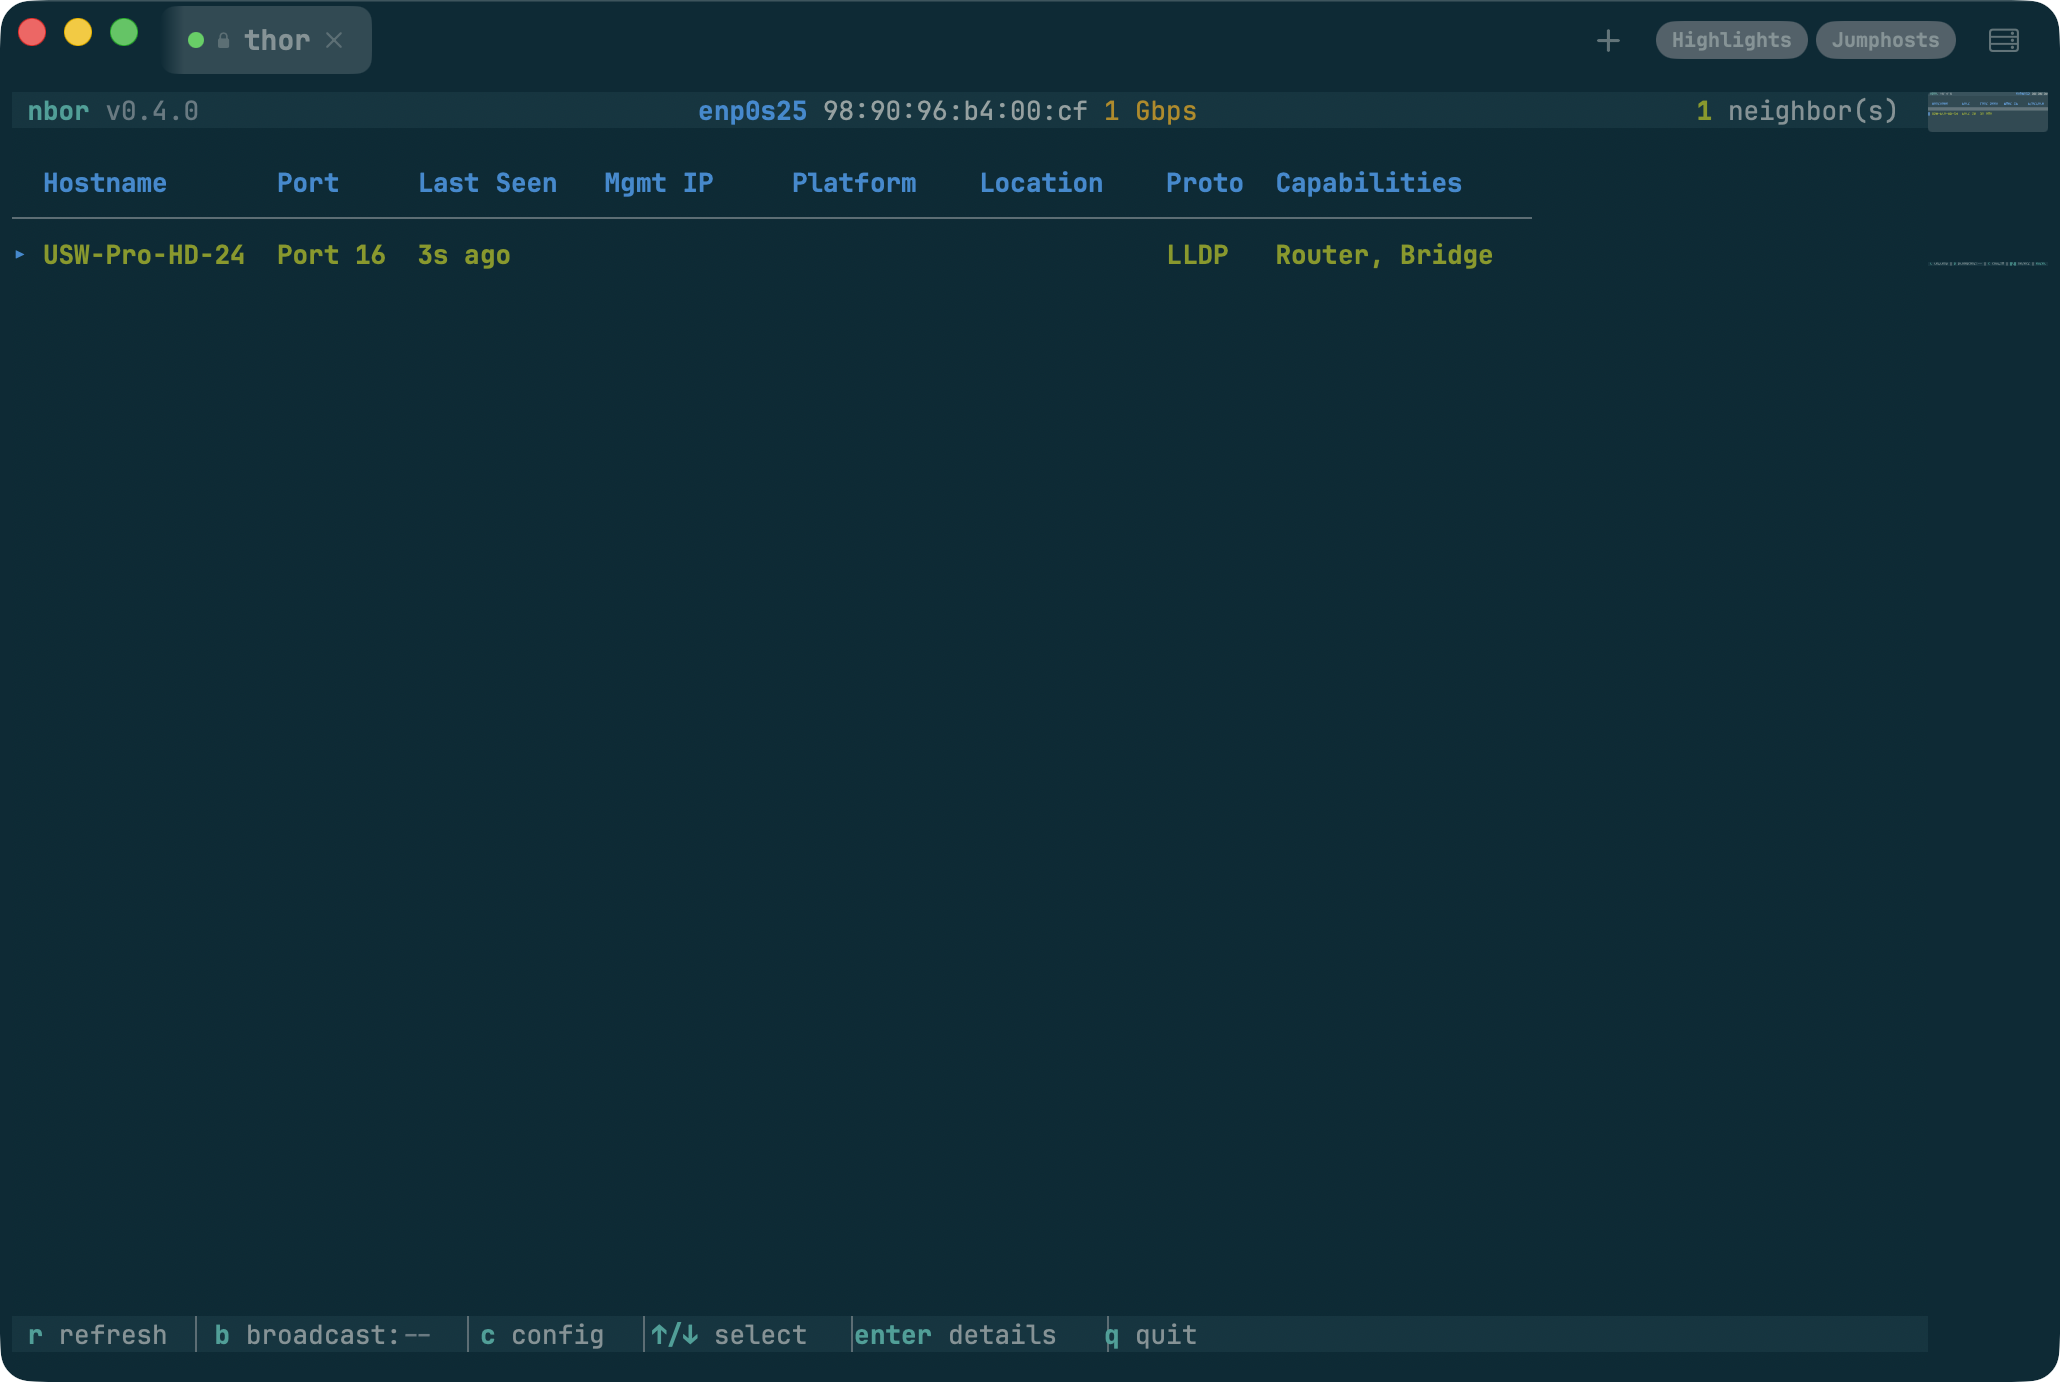
That was the useful part. Then, as usual, I went completely overkill with it. Twenty built-in color themes. Solarized, Dracula, Tokyo Night, Catppuccin, the works. CSV logging with timestamps. A full broadcast mode that announces your laptop back to the network via CDP and LLDP with customizable identity and capabilities. A nested settings menu system. It’s a neighbor discovery tool that somehow ended up with more themes than most text editors. But honestly, that’s the fun part. You solve the real problem in a weekend, and then you spend the next month making it beautiful.
Give it a spin:
brew install tonhe/tap/nborGitHub URL: github.com/tonhe/nbor
» If this would’ve saved you time, star it. That’s how I decide what to keep building. «
flo: I Just Need to See This Interface Right Now
Project repo: flo on GitHub
There’s a gap between “no monitoring” and “full monitoring stack.” When I’m troubleshooting, I often just need to see traffic on a handful of interfaces across a few devices. Right now, not after I configure a Grafana dashboard and wait for the next polling cycle.
flo is an SNMP interface monitor that runs in your terminal. Point it at a device, it walks the interface table, and you get a live dashboard with sparkline graphs showing traffic per interface. You can set up multiple dashboards for different devices and switch between them while they all poll in the background. Drill into an interface and you get a detail view with ASCII line charts for in/out traffic over time.
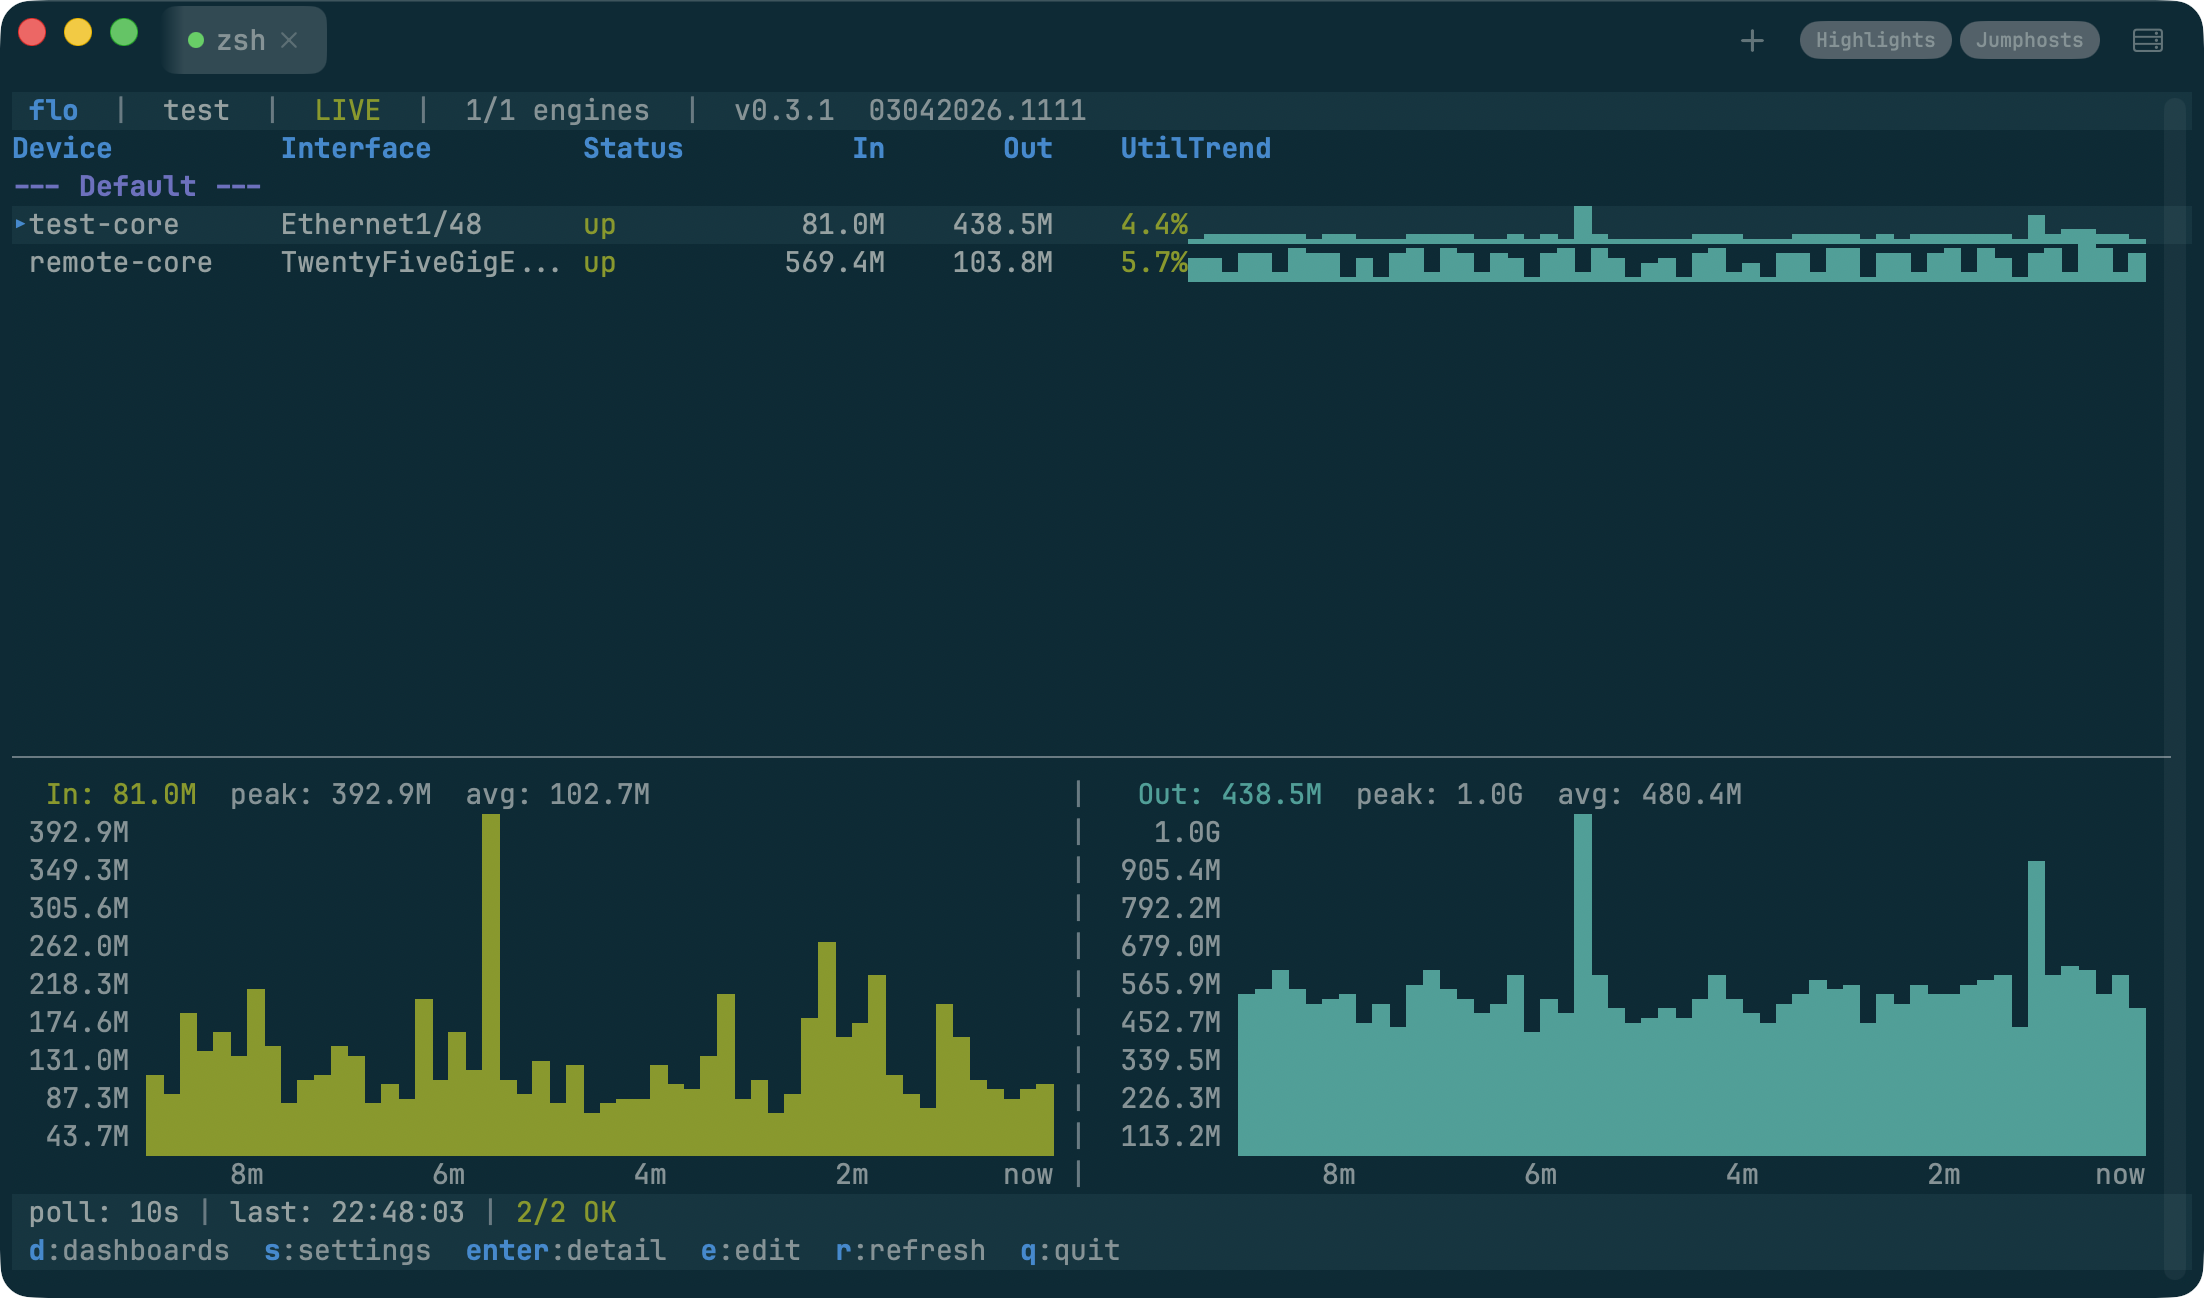
One thing I spent more time on than I expected was credential management. SNMPv3 auth is already painful enough without storing community strings in plaintext config files. flo encrypts credentials with AES-256-GCM and derives keys with Argon2id. You set a passphrase once and your identities stay locked. It felt like the right thing to build in from the start. Network engineers are terrible about credential hygiene (myself included), and if I’m going to use a tool every day, I want it to be secure by default.
Give it a spin:
brew install tonhe/tap/floGitHub URL: github.com/tonhe/flo
» If this looks useful, give it a star. That’s where I’ll invest more time. «
viaduct: Traceroute Lies to You
Project repo: viaduct on GitHub
This is the one I’m most excited about. The headline feature is real ECMP multipath discovery. Modern networks route traffic across multiple equal-cost paths, but classic traceroute only ever shows you one. viaduct (the command is via) sends UDP probes with varying source ports to walk different ECMP flows simultaneously. It displays all the parallel paths it finds at each hop with tree connectors, along with stability percentages showing how consistently each path appears over a rolling window. When you’re debugging asymmetric routing or trying to understand why some flows hit a congested link and others don’t, this is the information you actually need. And you get it in a live TUI with sparkline-style latency stats updating in real-time.
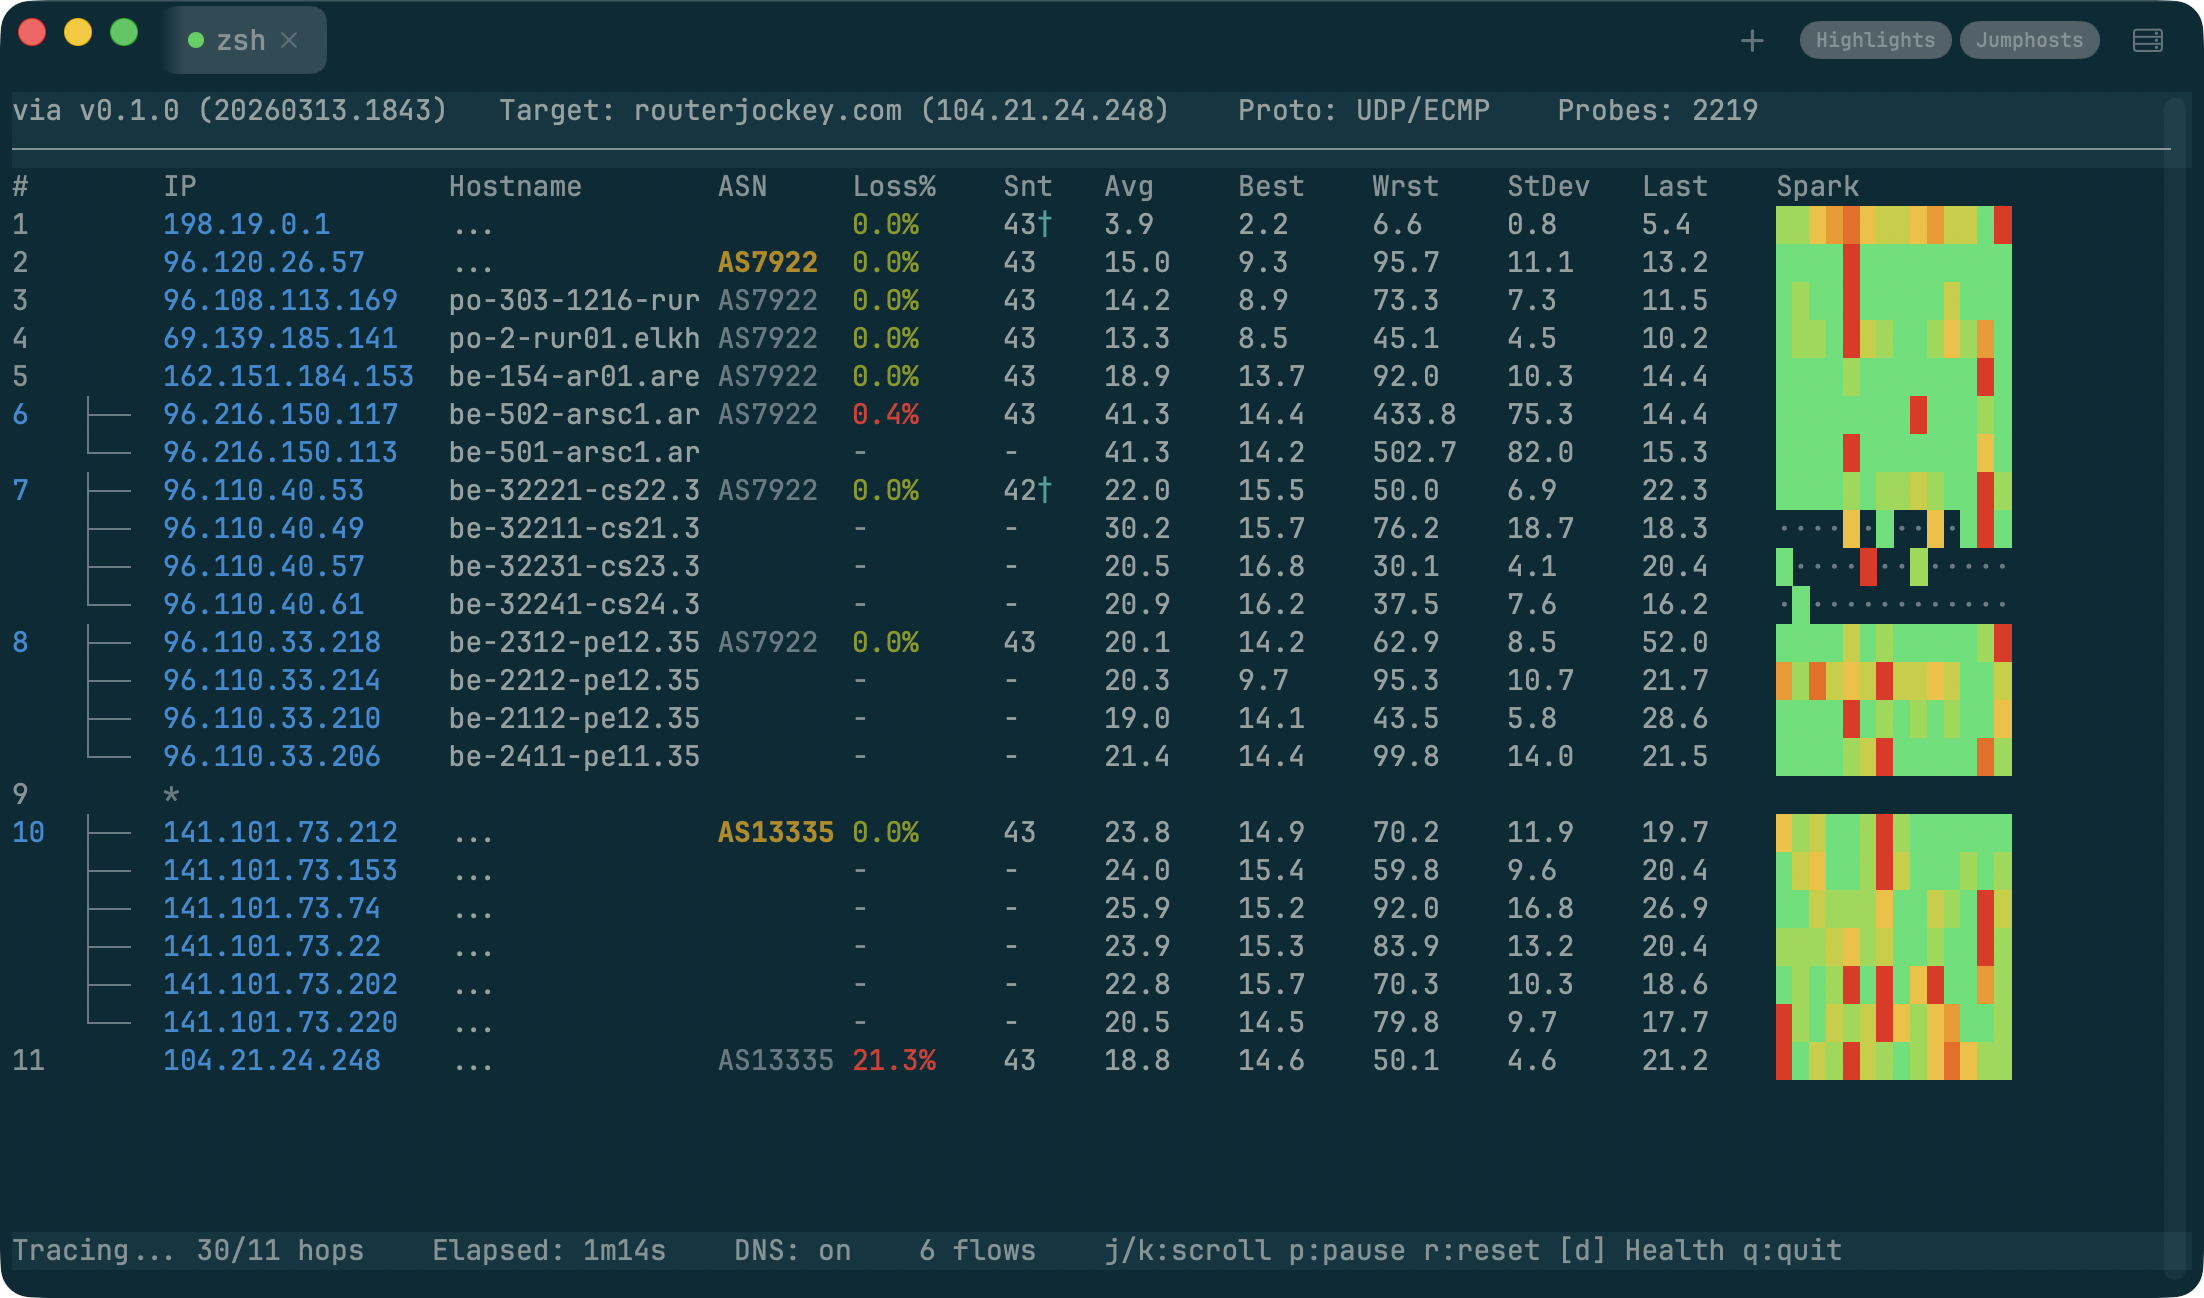
It also fixes the other thing that drives me crazy about traceroute. If you’ve spent any time looking at mtr output, you’ve seen it. Hop 4 shows 60% packet loss, but the destination is perfectly fine. The router is rate-limiting ICMP TTL Exceeded responses, not actually dropping traffic. But try explaining that to someone who just pulled up the traceroute and is convinced the network is on fire. viaduct detects when a hop’s loss pattern looks like rate-limiting (high loss at the hop, healthy hops downstream) and automatically switches to sending ICMP Echo Requests directly to that hop on a separate socket. The display swaps in the accurate ping stats and marks them with a dagger so you know what happened. No flags, no configuration. It just figures it out.
The whole thing is stupid fast because everything is async. Probes, DNS lookups, ASN enrichment, and the UI all run in their own goroutines and never block each other. Compare that to mtr where a slow reverse DNS lookup stalls the entire probe cycle. It’s a different experience.
Give it a spin:
brew install tonhe/tap/viaductGitHub URL: github.com/tonhe/viaduct
» If you’d actually run this in your environment, throw it a star. That’s the signal I follow. «
wiremap: Walking Into a Network You Didn’t Build
Project repo: wiremap on GitHub
This one comes from the assessment side of the job. You’re at a new client site, or you’ve inherited a network through an acquisition, and you need to understand what’s there. The topology, the inventory, the configuration state, all of it. The traditional approach is SSH into the core, check CDP neighbors, SSH into those, repeat, and keep a spreadsheet open the whole time.
wiremap started as a fork of my good friend and co-worker Aaron Conaway’s neighbor-mapper project. He had built a Flask app that did a good job tackling network device discovery, and it was just enough to make me think “what if I kept going?” He gave me the green light, and I ran with it. The framework he set up was solid, and I just kept bolting things onto it.
At this point it does a recursive breadth-first crawl through the network via CDP and LLDP, collecting data from every device it discovers. It supports over a dozen vendor platforms: Cisco IOS, NX-OS, IOS-XR, Arista, Juniper, Palo Alto, MikroTik, Fortinet, and more. Fifteen modular collectors run on each device, pulling everything from interface status and ARP tables to STP topology, routing neighbors, and running configs.
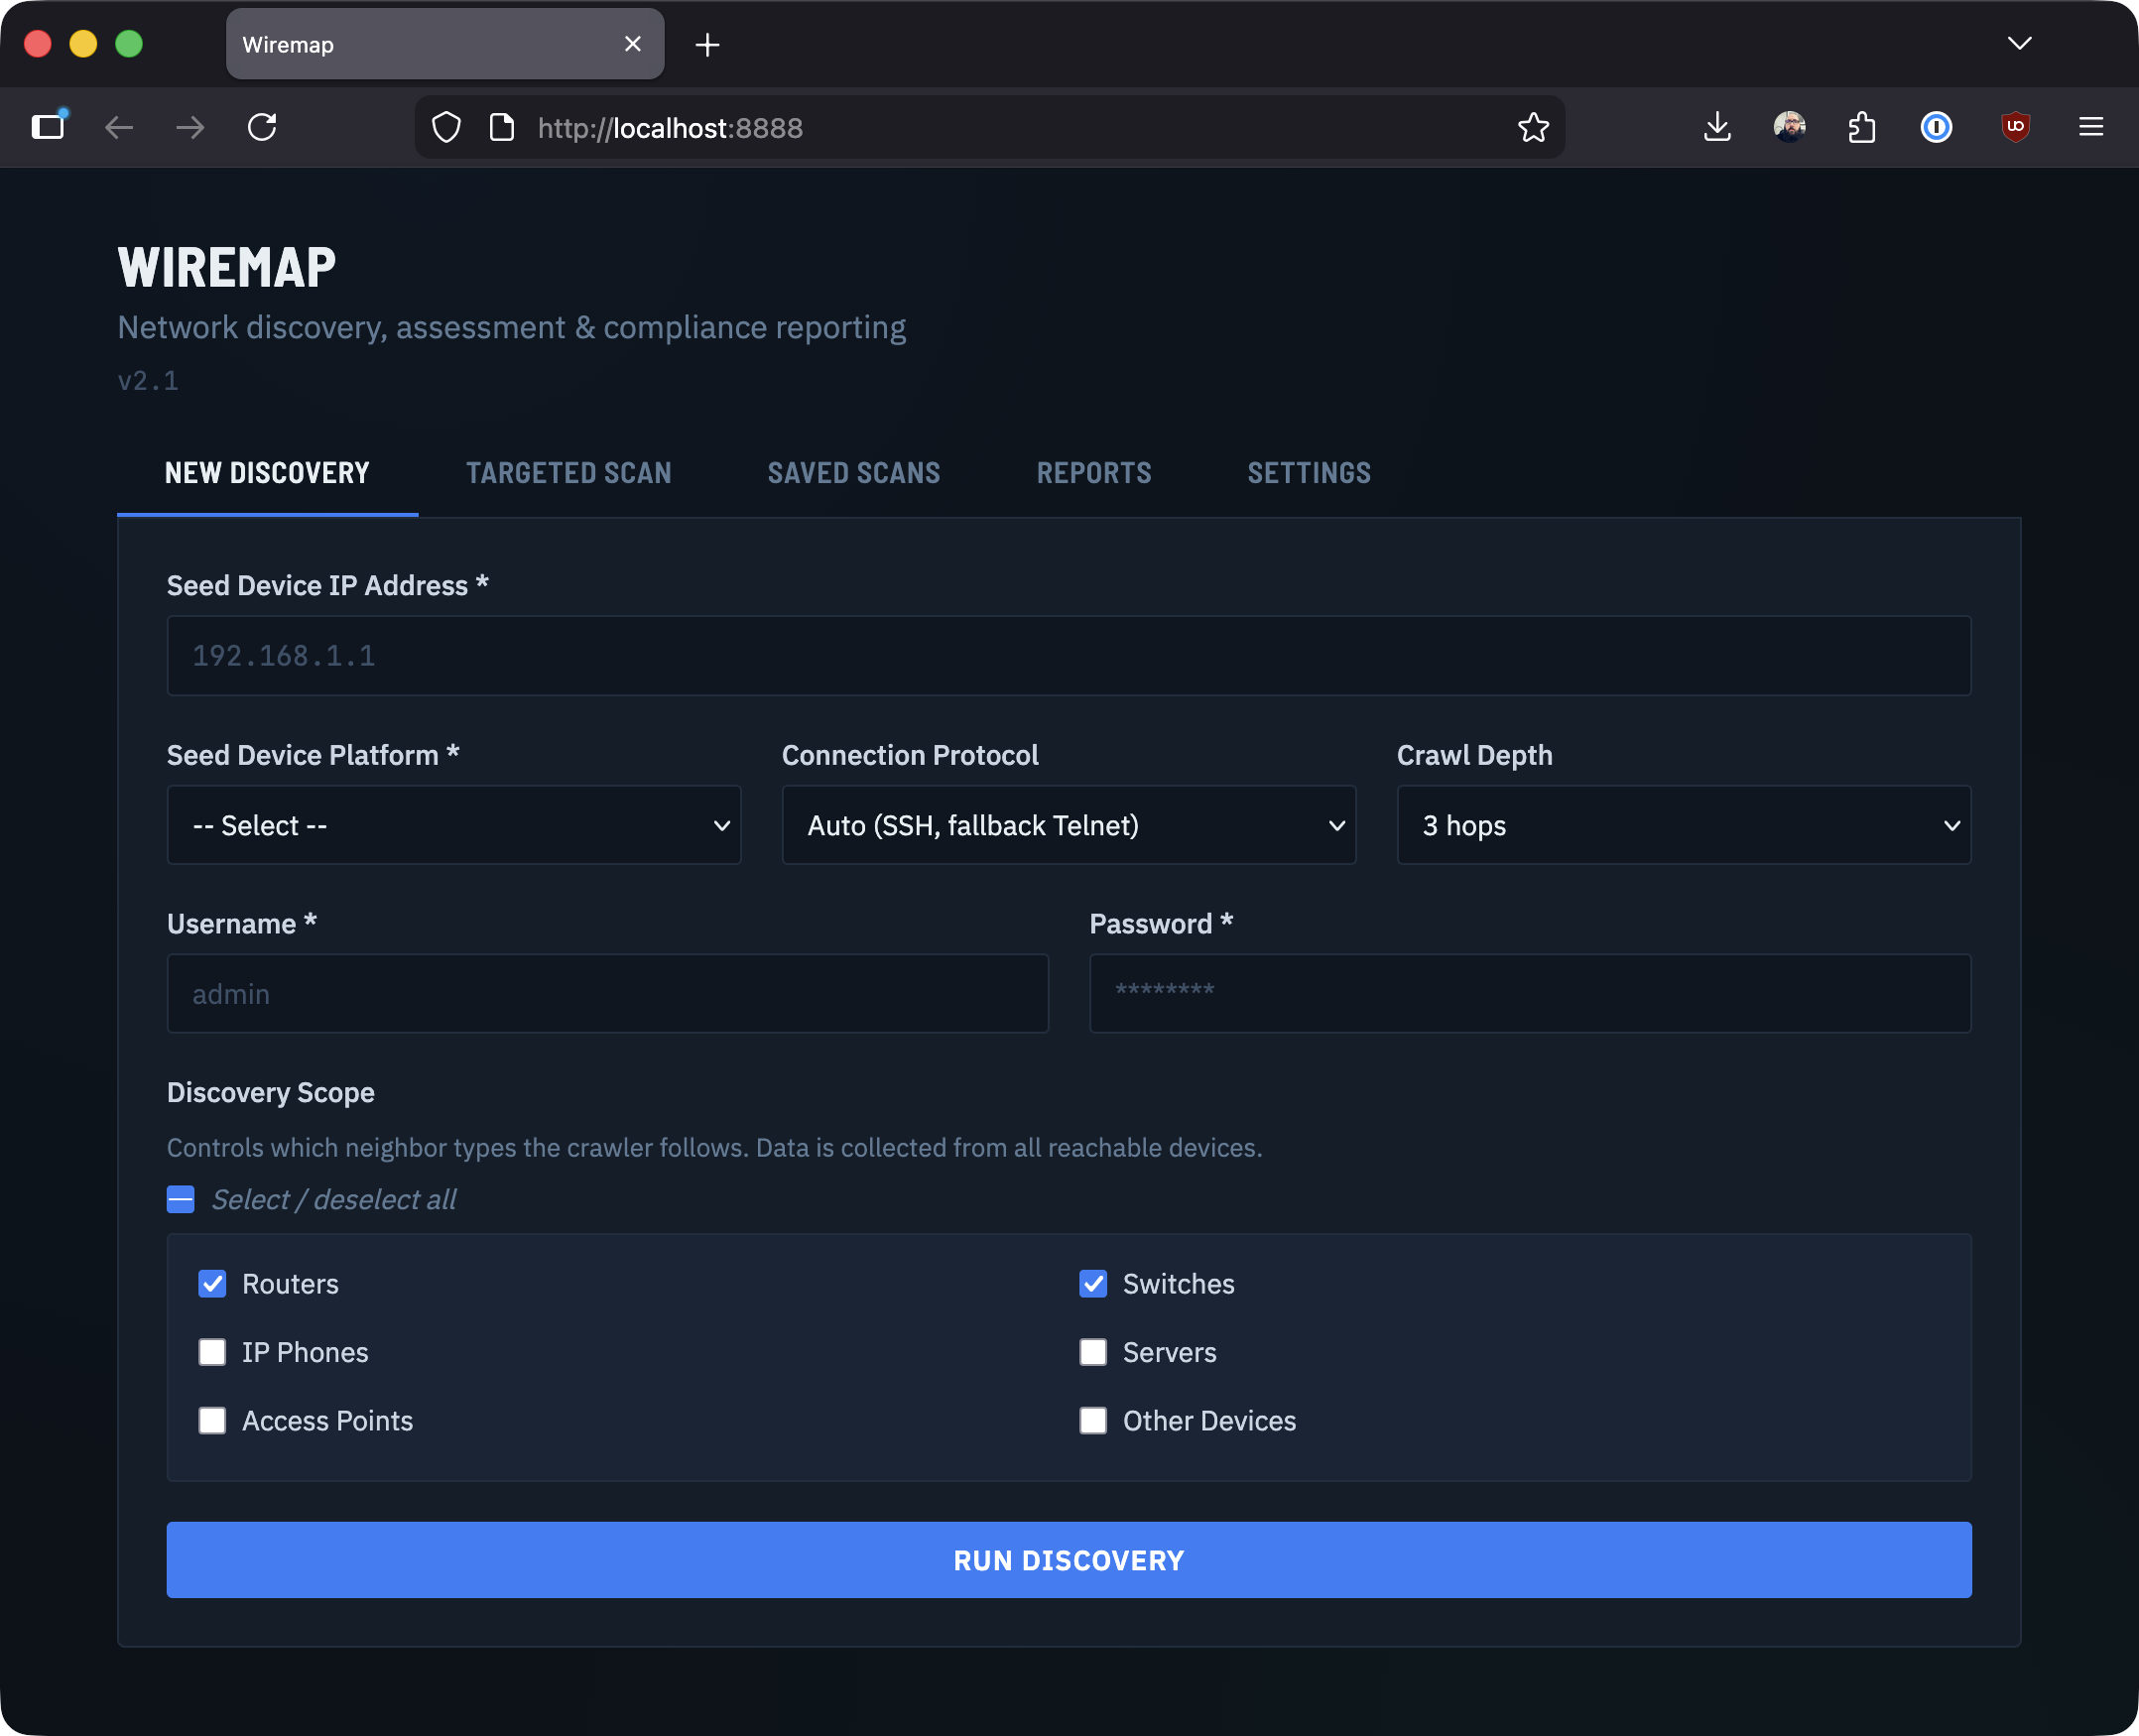
wiremap is Python because that’s where the ecosystem is. Netmiko for device connections, NTC Templates for parsing CLI output. The output is a set of assessment reports: device inventory, link maps, L2/L3 analysis, an interactive D3.js topology diagram, even Cisco EOX lifecycle data if you have API access. You can export to Excel, JSON, CSV, or XML depending on who’s consuming it. The whole thing runs in a browser with real-time progress streaming via SSE, so you can watch the crawl happen live.
Give it a spin:
git clone https://github.com/tonhe/wiremap
cd wiremap
docker compose up -d
# open your browser to http://localhost:8888
GitHub URL: github.com/tonhe/wiremap
» If you’ve ever needed this, you know the drill. Star it if you want me to keep pushing it forward. «
Why Terminal Tools?
Three of these projects (nbor, flo, and viaduct) are built with Go and the Charmbracelet ecosystem (Bubble Tea, Lip Gloss, Bubbles). Finding Bubble Tea was a turning point. I love Terminal UIs (TUIs) and I strongly believe they don’t have to look like they were designed in 1997. The framework uses an Elm-inspired model/view/update architecture that makes complex interactive interfaces surprisingly manageable, and the result is a single static binary with zero runtime dependencies. brew install and you’re done.
There’s something satisfying about CLI tools. They compose. They’re fast. They work over SSH. They don’t need a browser tab. For the kind of ad-hoc troubleshooting that network engineers do every day, a good terminal tool beats a web dashboard every time.
A Note on AI
I’d be lying if I didn’t mention that AI coding assistants accelerated my work on these utilities. They’re good at the mechanical parts: scaffolding a new module, writing parsers, grinding through boilerplate. That freed me up to focus on the design decisions, the networking side of the code, and domain logic that actually matter. The tools are better because I could iterate faster. Curious how many of you are actually using it vs avoiding it, let me know.
What’s Next: conduit
I’ve also been experimenting with a native macOS SSH and terminal session manager called conduit. I wanted something that feels like it belongs on a Mac. Hierarchical session folders, credential management, jump host support, multiple tabs. The options out there are either legacy apps that haven’t aged well, Electron wrappers, or yearly software rental fees for something that should just run locally. conduit is built in Swift with SwiftUI and SwiftNIO, supports SSH, Telnet, and Serial connections, and handles credential encryption with Touch ID unlock. It’s still early, but I’m hoping to get it on the Mac App Store eventually.
If you’re wondering what terminal is in the screenshots above, that’s conduit.
I have to say, I thought a session manager would mostly be easy, bolt an existing terminal emulator project onto some SSH code, and you’re half way there. Sadly that’s not the case at all. Software like SecureCRT works so well because they have 20 years of building their SSH stack. Apple’s NIOSSH didn’t support legacy ciphers, which, if you want to connect to something like an ASA, or even a 2960x is going to be a big roadblock. So ontop of having to add cool features like Themes, a minimap, and “broadcast input” support, I had to add a bunch of legacy ssh code to Apple’s project.
The Bigger Picture
Network engineers who write code aren’t just “doing automation.” We’re building the next generation of operational tools. The people who understand the problem, who’ve stood in the wiring closet, stared at the misleading traceroute, SSH’d into 200 devices with a spreadsheet, are the ones best positioned to solve it.
These tools aren’t products. They’re what happens when curiosity meets frustration and you decide to do something about it. If you’re a network engineer thinking about building something, my advice is simple: start with the thing that annoys you the most. The best tools come from real problems.
Fair warning: none of this is production-hardened software. It’s all beta at best, and some of it is barely past “works on my machine.” But that’s kind of the point. These are tools I built because I needed them, and I’m sharing them because maybe you do too.
If any of this looks useful, star the repo. That’s how I decide what to keep building.
If it’s broken, tell me. If you’ve built something similar, I want to see it.
All four projects are here: https://github.com/tonhe.
I’m building these based on real problems, so feedback actually matters here.
So, What’s the one tool you wish existed? I’m always looking for the next thing to build.