
octomon: Is It the Wi-Fi, the ISP or the Internet?
octomon is a free, open source terminal dashboard that watches latency, bandwidth, Wi-Fi, DNS and your own machine at once, learns what normal looks like on each network, and tells you which layer it thinks is failing. I ran it on a MacBook over Wi-Fi and broke things on purpose to see how often it's right.
The video call freezes, and everyone in the house has a theory. The Wi-Fi is bad again. Comcast is doing Comcast things. Something is wrong with “the internet.” Usually nobody checks, because checking means a ping in one window, a traceroute in another, a speed test in a browser tab and a look at the Wi-Fi menu, and by the time all of that is open the call has recovered.
octomon puts all of that on one screen and then takes a guess at the answer. Ivan Pepelnjak filed it under Worth Having on ipSpace.net after it came through the Packet Pushers newsletter. I wanted to know how far to trust the guess, so I put it on my MacBook, left the MacBook on Wi-Fi, and spent a night breaking things on purpose.
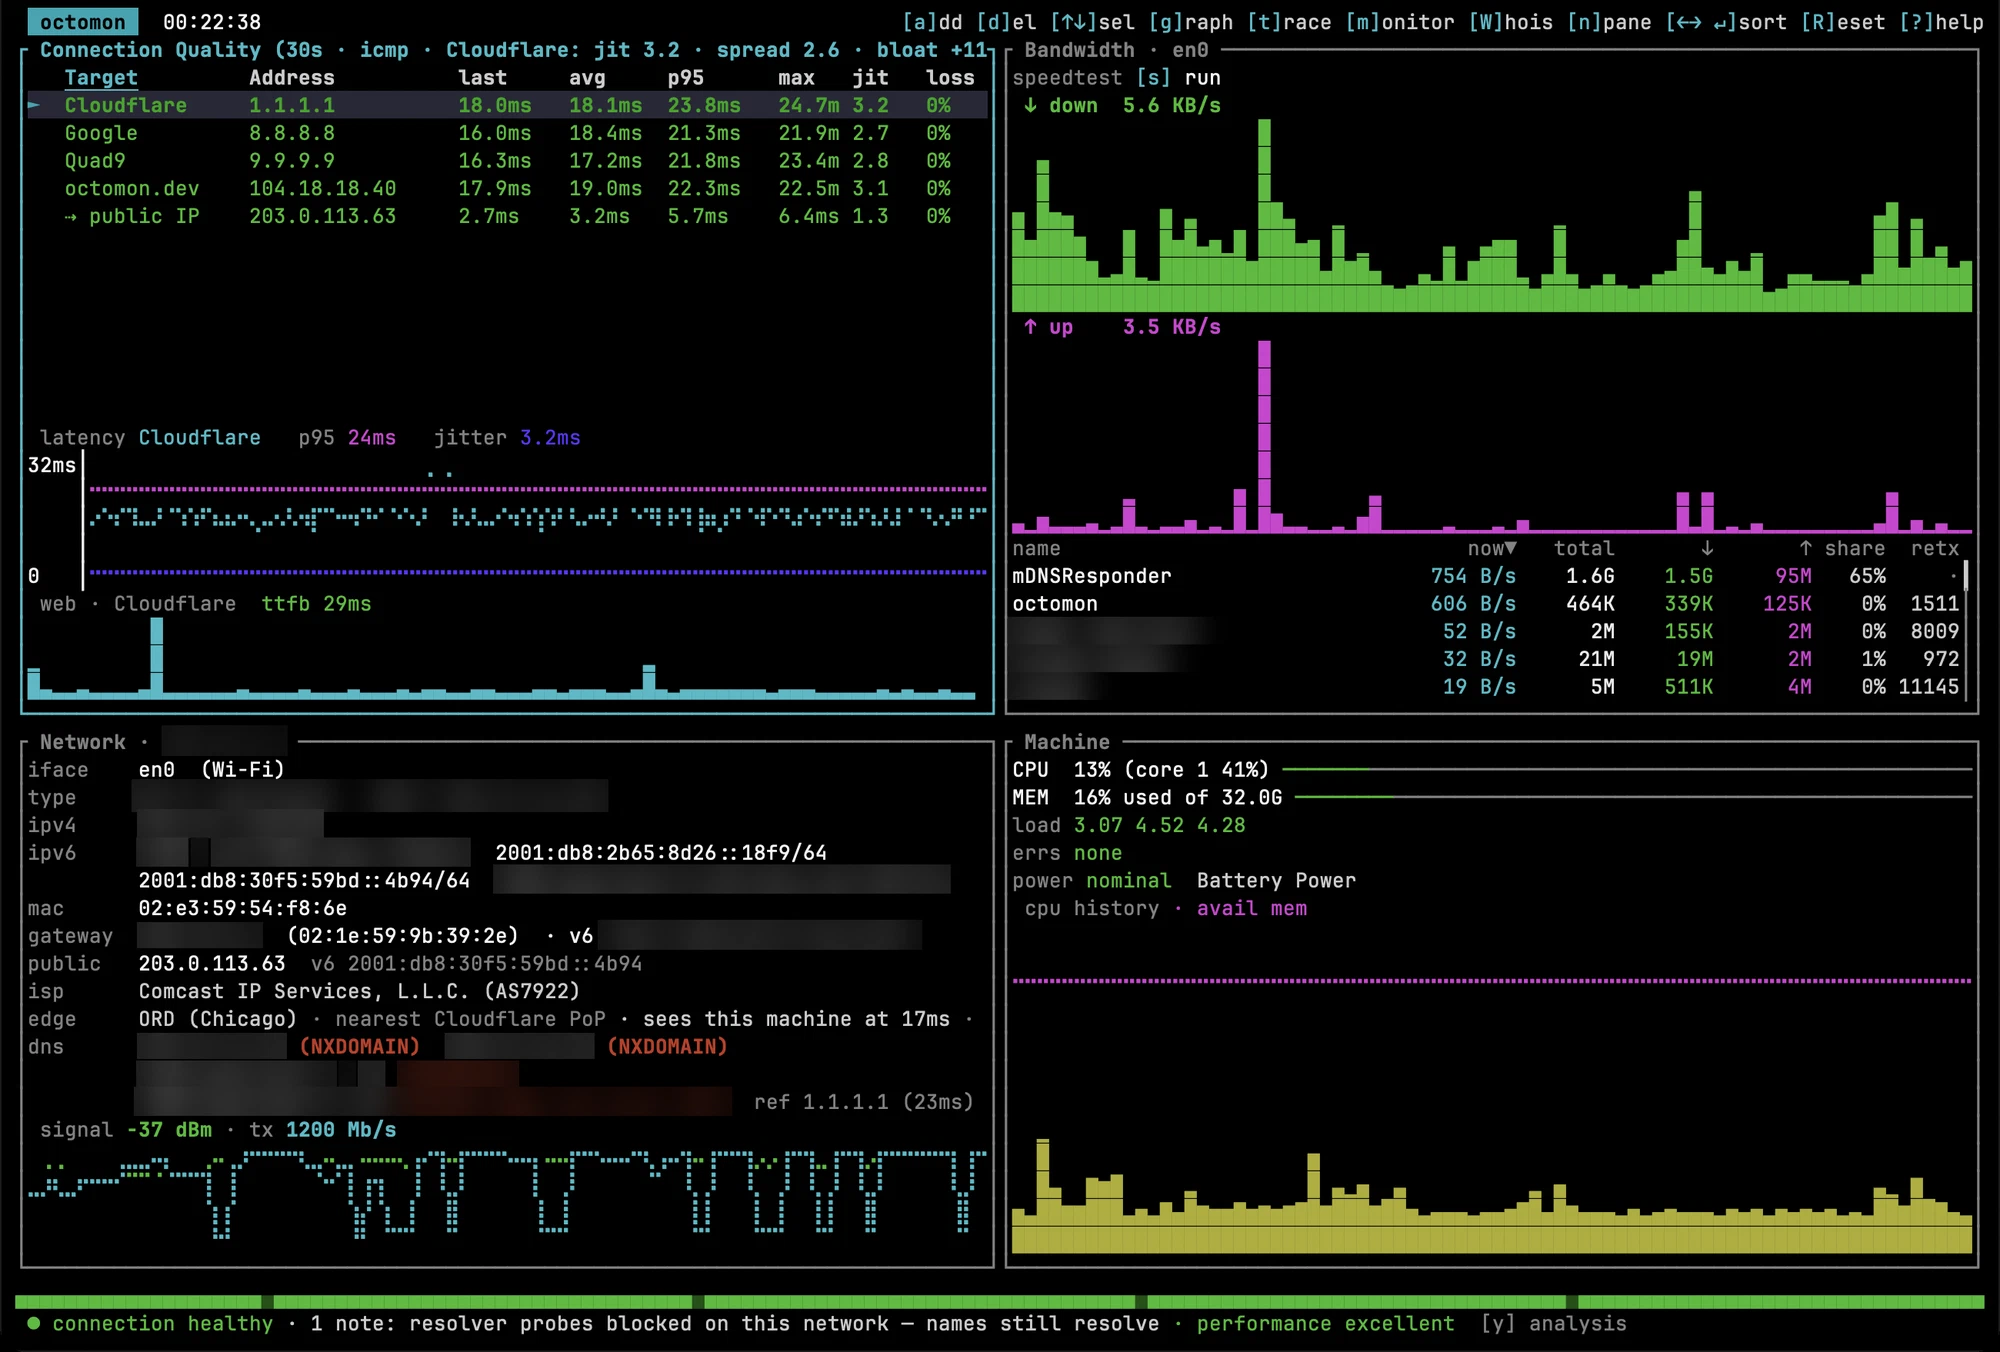
octomon is a btop style terminal dashboard written in Rust by Simon Thorpe (securitypedant on GitHub), dual licensed MIT or Apache 2.0, with builds for macOS, Linux and Windows. The README describes it as ping, traceroute, ifconfig, btop, trippy and bandwhich in one view. The part none of those tools have is a one line verdict at the bottom of the screen, backed by a per network baseline of what normal looks like where you’re sitting. Everything below is v0.11.9 on macOS 27.0.1, over 802.11ax on a 5 GHz channel, on a Comcast connection that tests at about 650 Mb/s down and 40 up.
Install it
On a Mac it’s a third party Homebrew tap, and recent Homebrew makes you trust the tap once before it’ll install from it…
brew tap securitypedant/octomon
brew trust securitypedant/octomon
brew install octomon
brew install iperf3 terminal-notifier
The last line is optional but you’ll want both. iperf3 powers the LAN speed test I’ll get to below, and terminal-notifier makes desktop alerts open your terminal when clicked instead of Script Editor.
Linux gets an apt repository and a static musl installer that drops the binary in ~/.cargo/bin, Windows gets winget install SimonThorpe.Octomon, and cargo install octomon works anywhere with Rust 1.95 or newer. The README has the exact lines for each.
On macOS, sort out three things before the first run.
- Use a font with braille glyphs. The graphs are drawn in Unicode braille. Terminal’s default font doesn’t have them, so the graphs come out as scattered dots. Any Nerd Font fixes it (I used JetBrainsMono Nerd Font Mono at 13 point).
- Set
LANG. octomon logs a warning when the terminal isn’t in UTF-8 mode, and the panel borders can come out garbled.export LANG=en_US.UTF-8in your shell profile. - The SSID needs Location Services. Recent macOS hides the network name from any app without the Location permission. octomon only says so in the full screen Network panel (
ssid hidden — needs Location Services). Everything else works without it.
It runs unprivileged and never asks for a password. The first launch shows a short welcome overlay explaining the verdict line and the session bar, and tells you to give it a minute or two to learn before trusting its comparisons.
Every screenshot in this post was taken with octomon --demo, which swaps your public IPv4 and IPv6 addresses, MAC addresses and SSID for documentation values. The README is upfront that the LAN, the resolvers and every traceroute hop stay real “because they are what a demo is about.”
What surprised me is what else stays real. The gateway’s global IPv6 address sits in the household’s delegated prefix, and it showed up unmasked in the target list. The gateway’s IPv6 link-local is EUI-64, so it spells out the gateway MAC that --demo hides on the same line. Sockets octomon can’t map to a process show up as quic6 <local address>, and that address is the Mac’s real global IPv6, which the README says --demo hides everywhere it appears. I blurred all of those, plus the ISP hops, which place you within a few miles. I also blurred my LAN addressing, my resolvers and the names of the apps in the process lists, so the screenshots here have more blur in them than --demo alone would give you. Look at your own captures before you post them.
The four panels
Connection quality
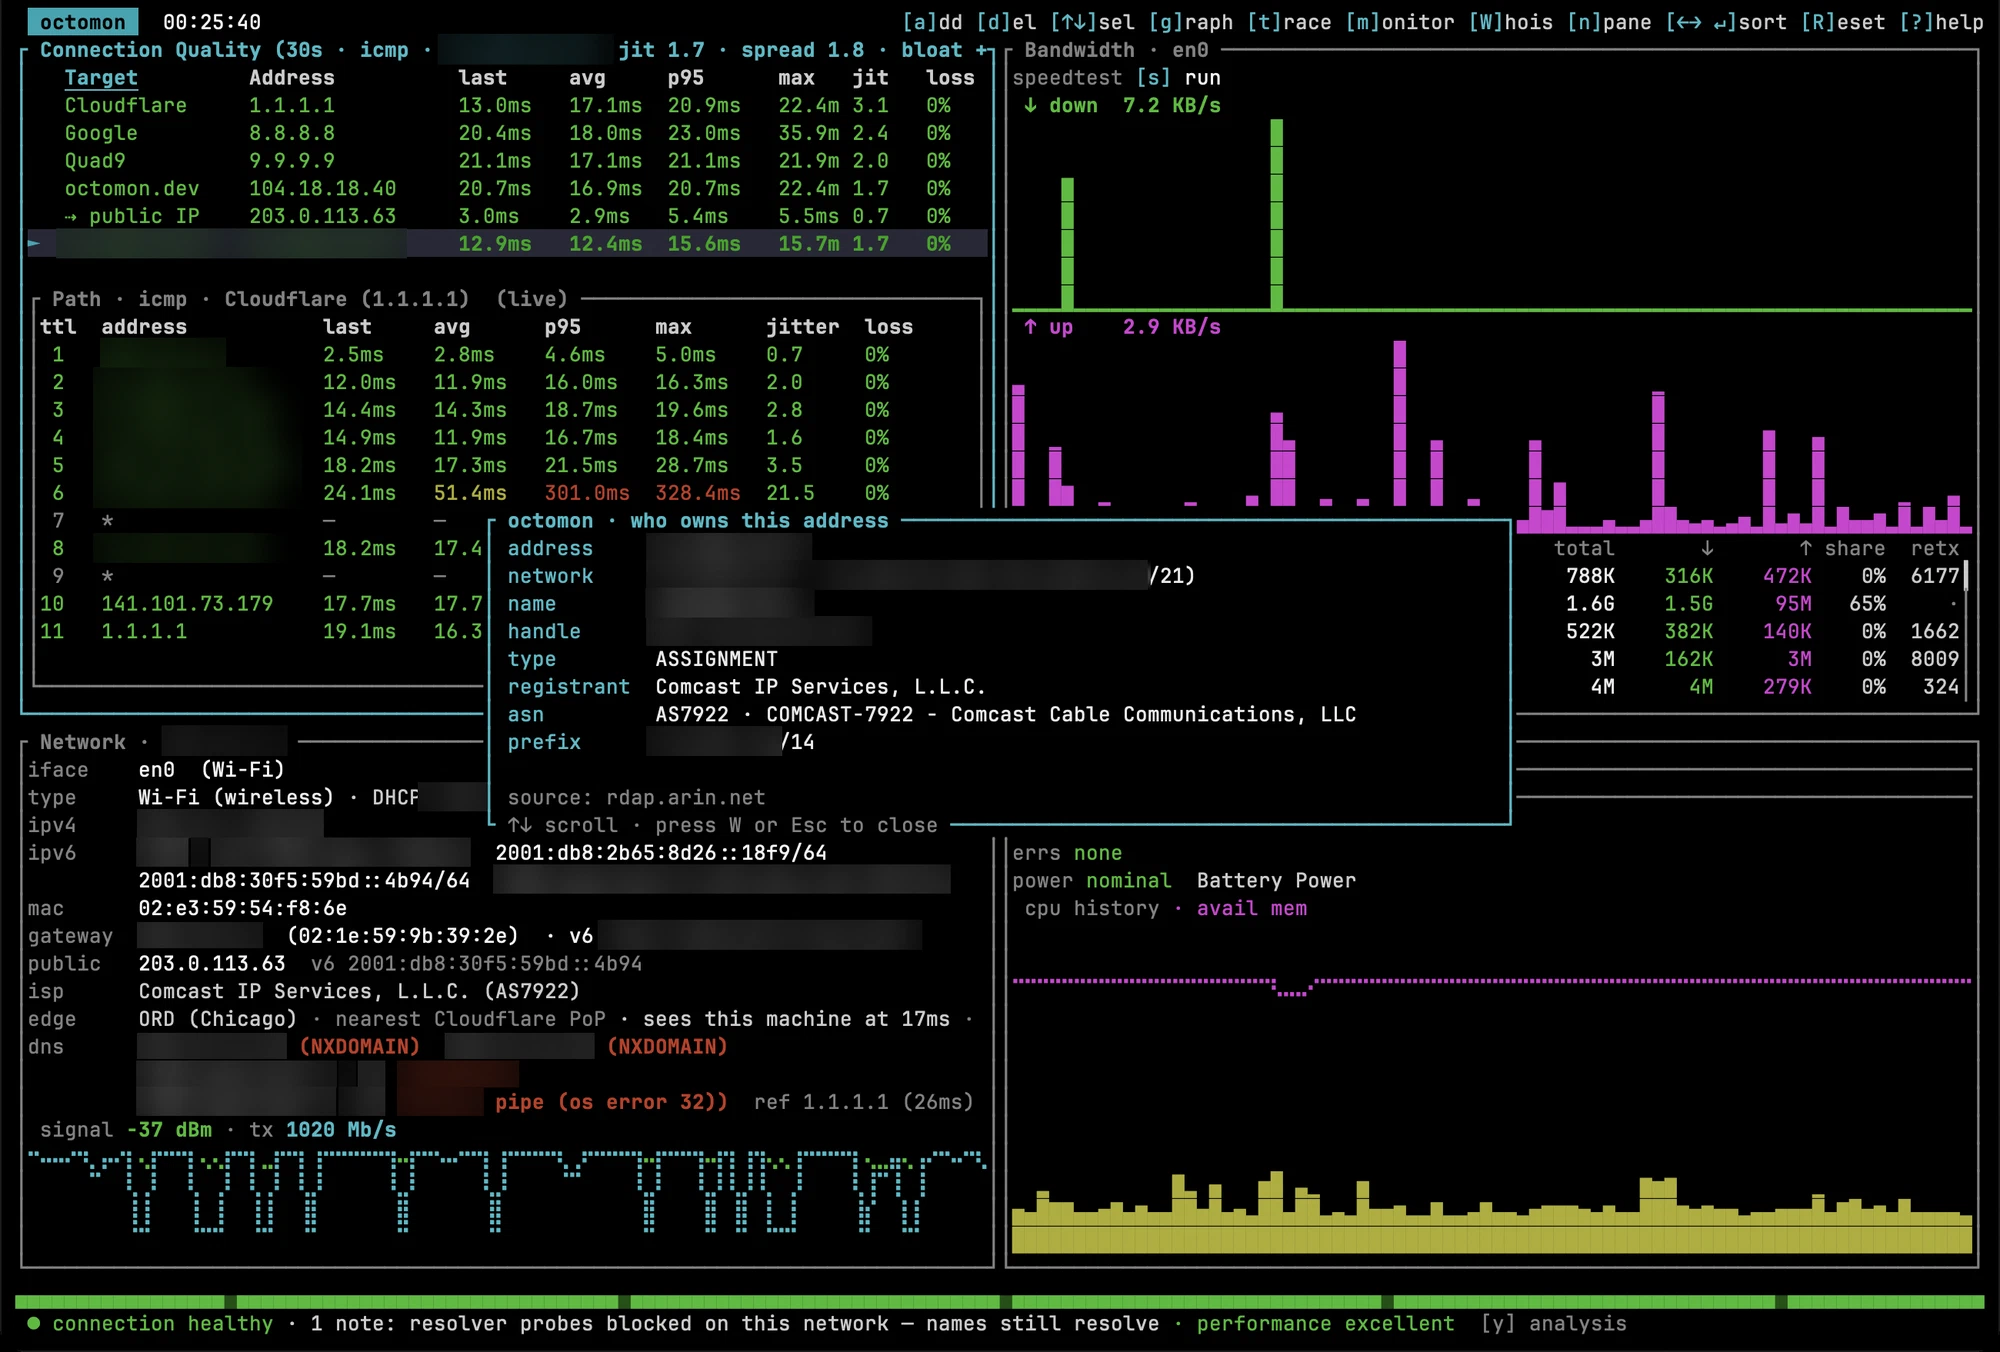
The top left panel pings a set of anchors once a second (Cloudflare 1.1.1.1, Google 8.8.8.8 and Quad9 9.9.9.9, plus octomon.dev) and shows last, average, p95, max, jitter, loss and a bufferbloat number for each. At startup it runs a traceroute and adds the gateway and the first ISP hops as targets too, over IPv4 and IPv6. The anchors are the only targets that vote on whether the internet is up. The gateway and hops are there so you can see where the latency starts.
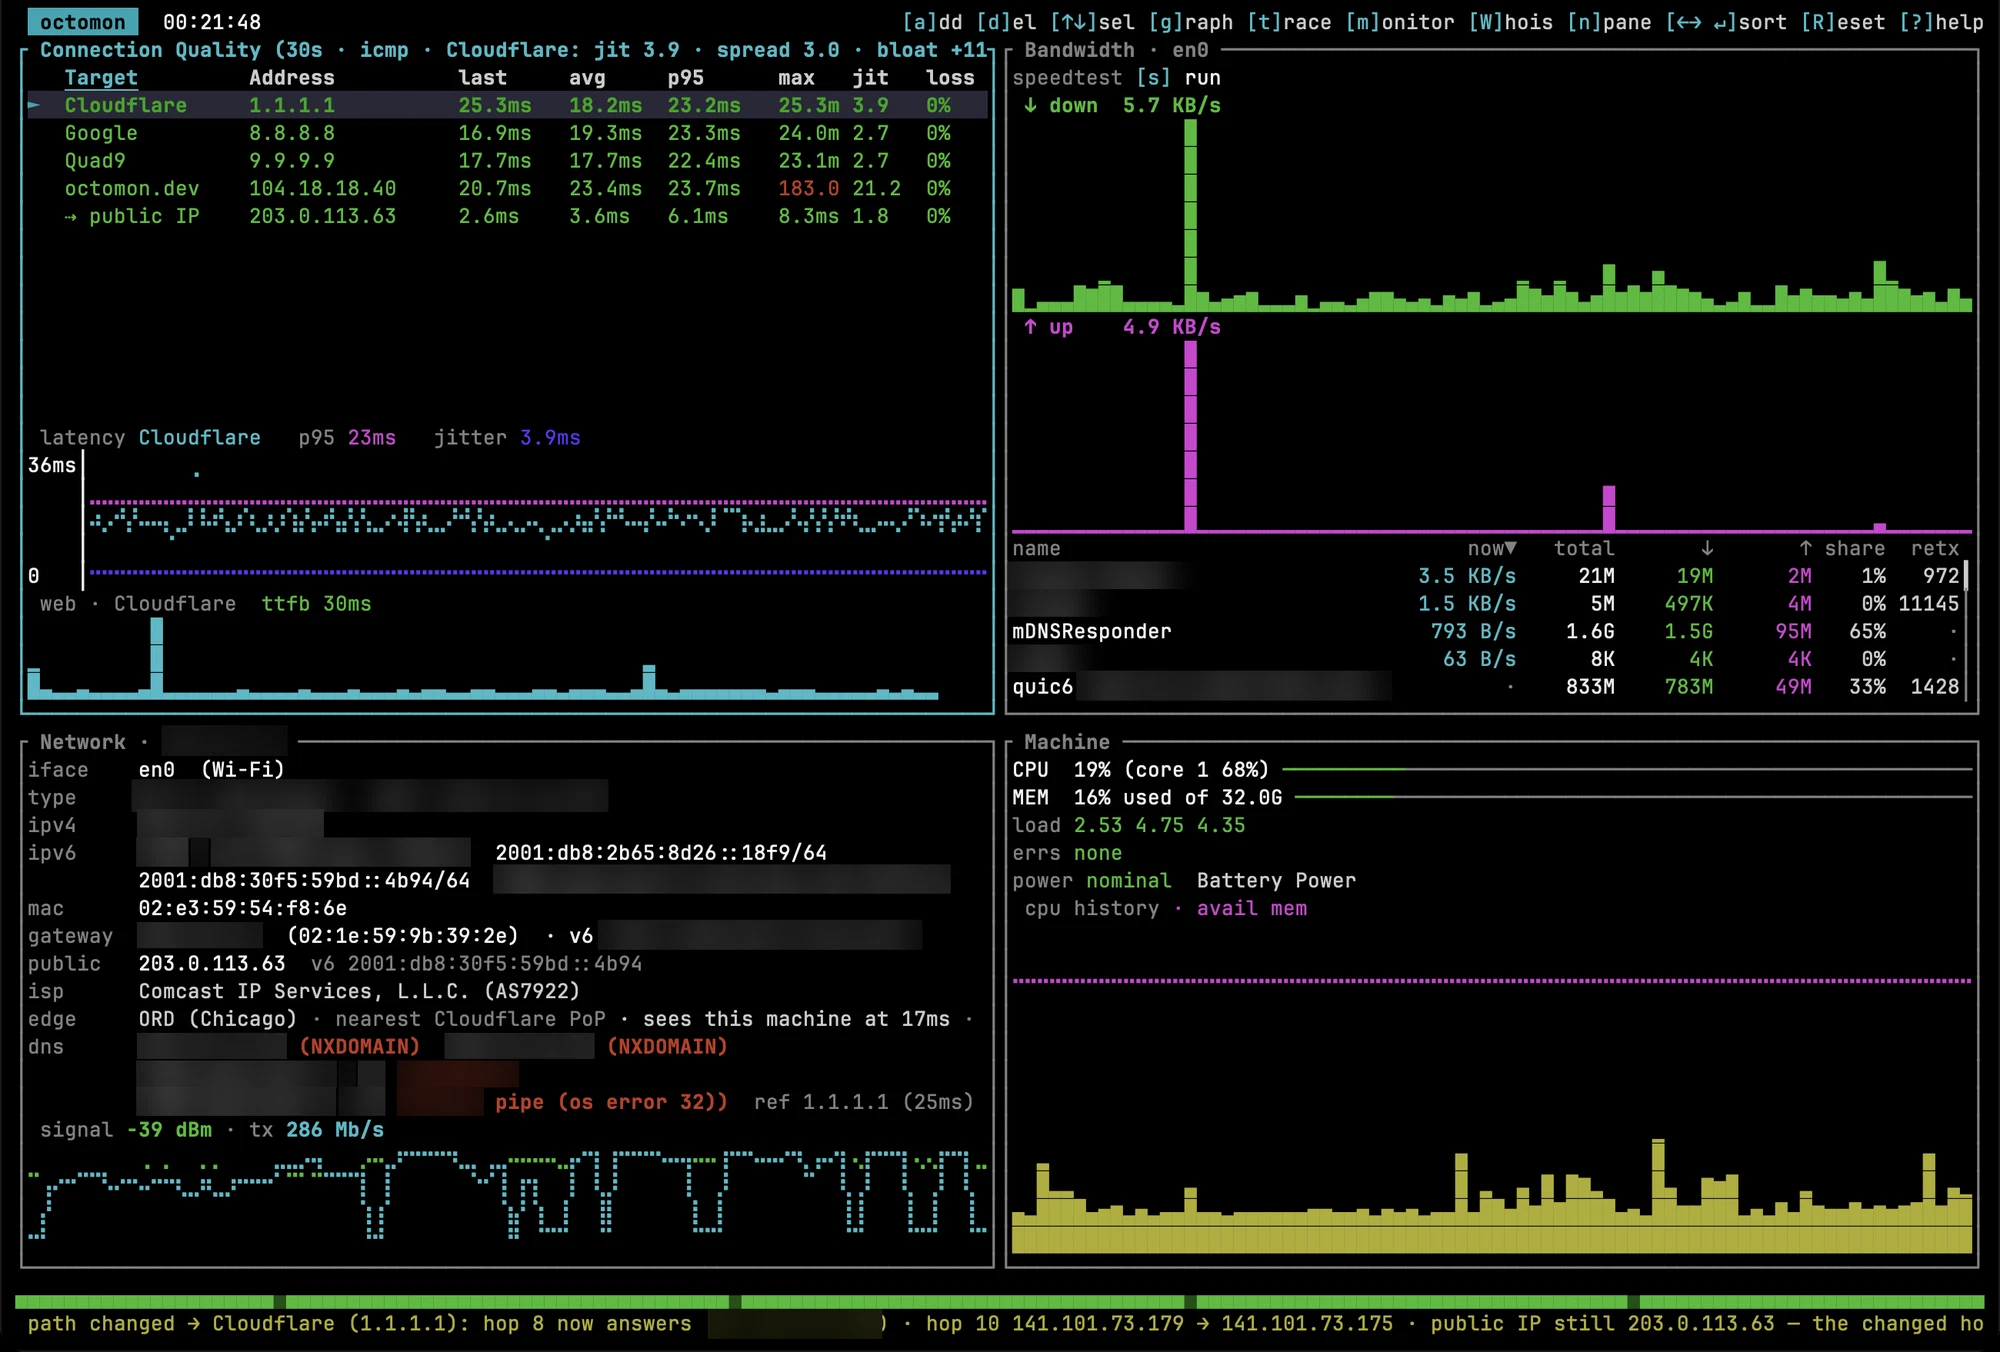
i flips the whole panel from ICMP to TCP connects on port 443. On a network that blackholes ping, this is the view that still works. The public IP row shows a dot under TCP because my router doesn’t answer on 443.
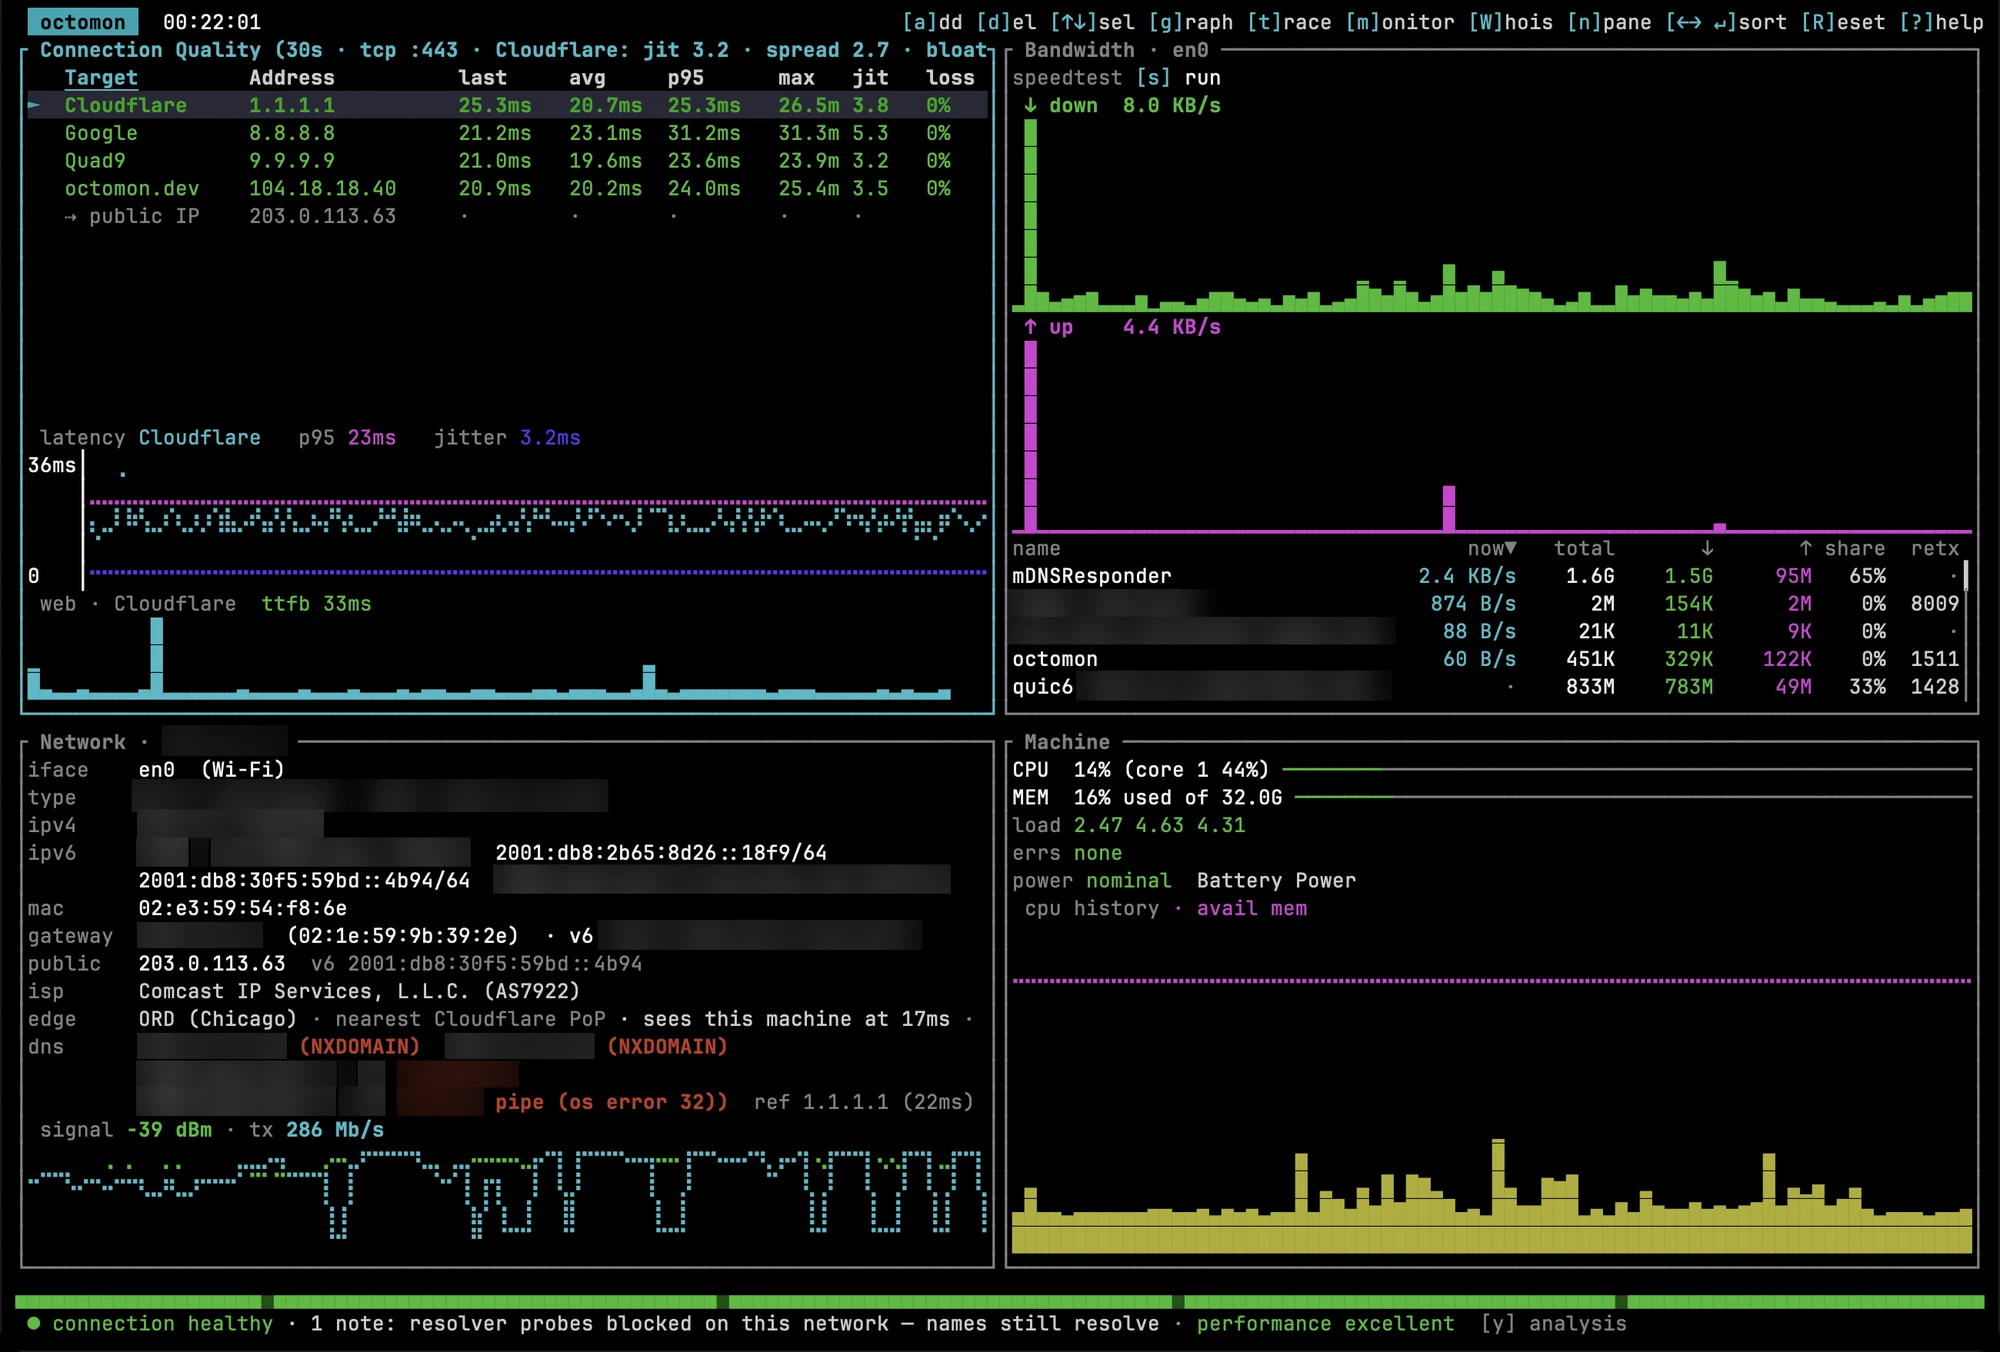
a adds your own target (the work VPN concentrator, a NAS, a game server) and d deletes one. d doesn’t ask for confirmation, and after deleting a target in my session the cursor got stuck on the last row and stayed there until I restarted octomon.
m opens an MTR style monitor of the path to the selected target, with per hop latency, jitter and loss, and the full screen view (f) adds a sparkline per hop. If that looks familiar, it’s similar to the view viaduct gives you.
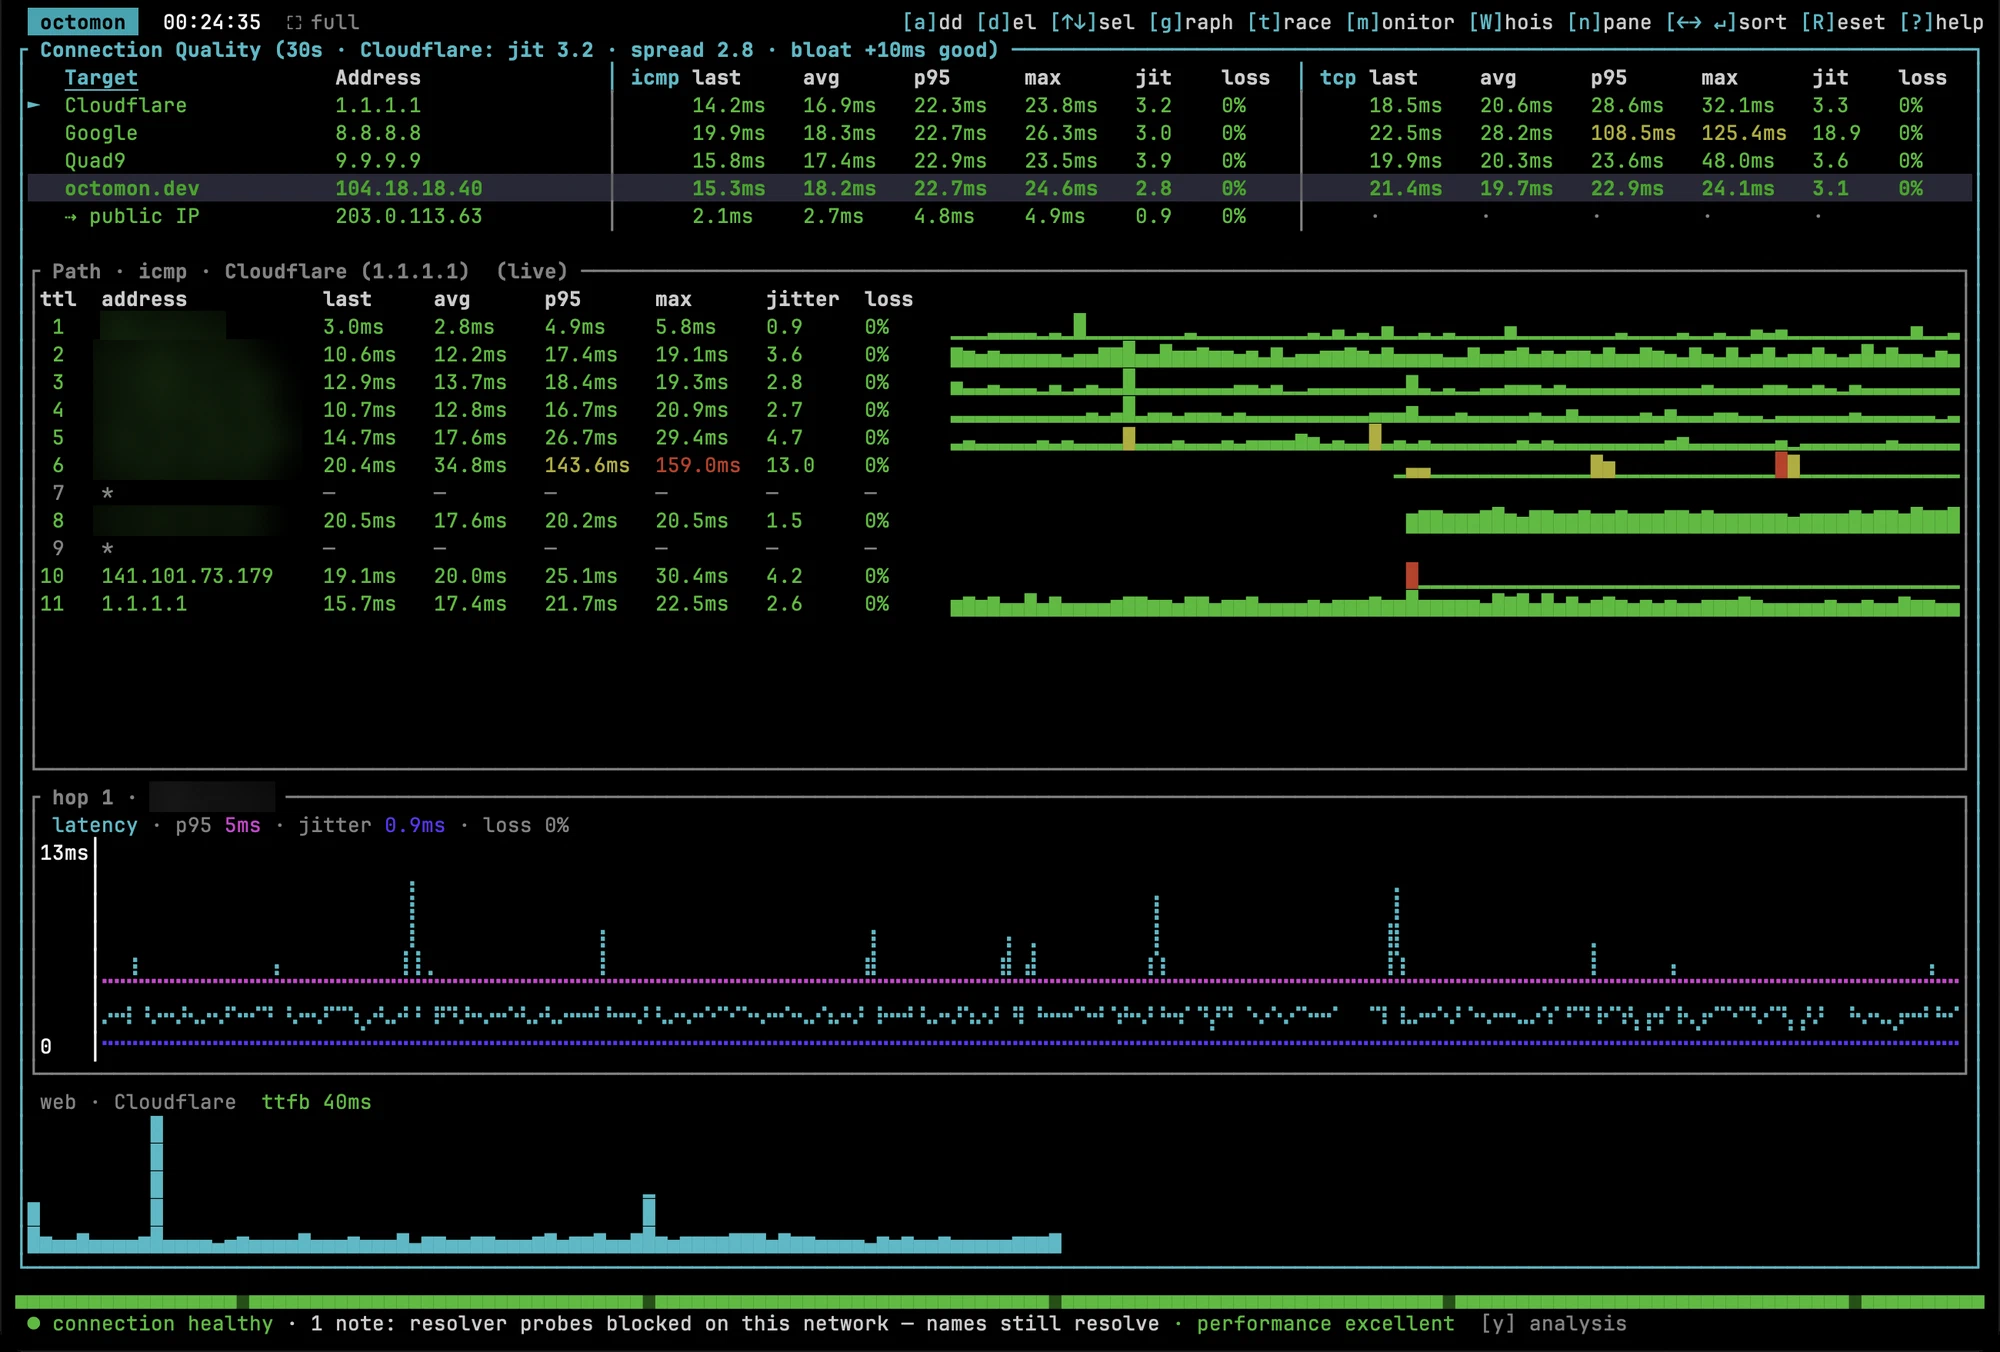
In this capture hop 6 was showing a p95 of 143 ms and a max of 159 ms while the destination behind it was fine. Hop 6 is a router deprioritizing the ICMP it generates itself, and octomon correctly ignored it. I’ve complained before about traceroutes that make people panic over exactly this, and viaduct double-checks a hop like that with direct pings before it trusts the loss, so I was glad to see octomon get it right too.
W runs a whois (RDAP) lookup on the selected address. In 0.11.9 the arrow keys only ever move the cursor in the target list, never in the path view, so you can’t select a hop to look it up. To whois one, add its address as a target with a, press W, and delete it again. The a prompt also won’t take the NAME=address form that --target accepts on the command line.
Bandwidth
The top right panel is live throughput on the active interface. s runs a speed test, and the result lands next to the graph along with the latency measured while the link was loaded.
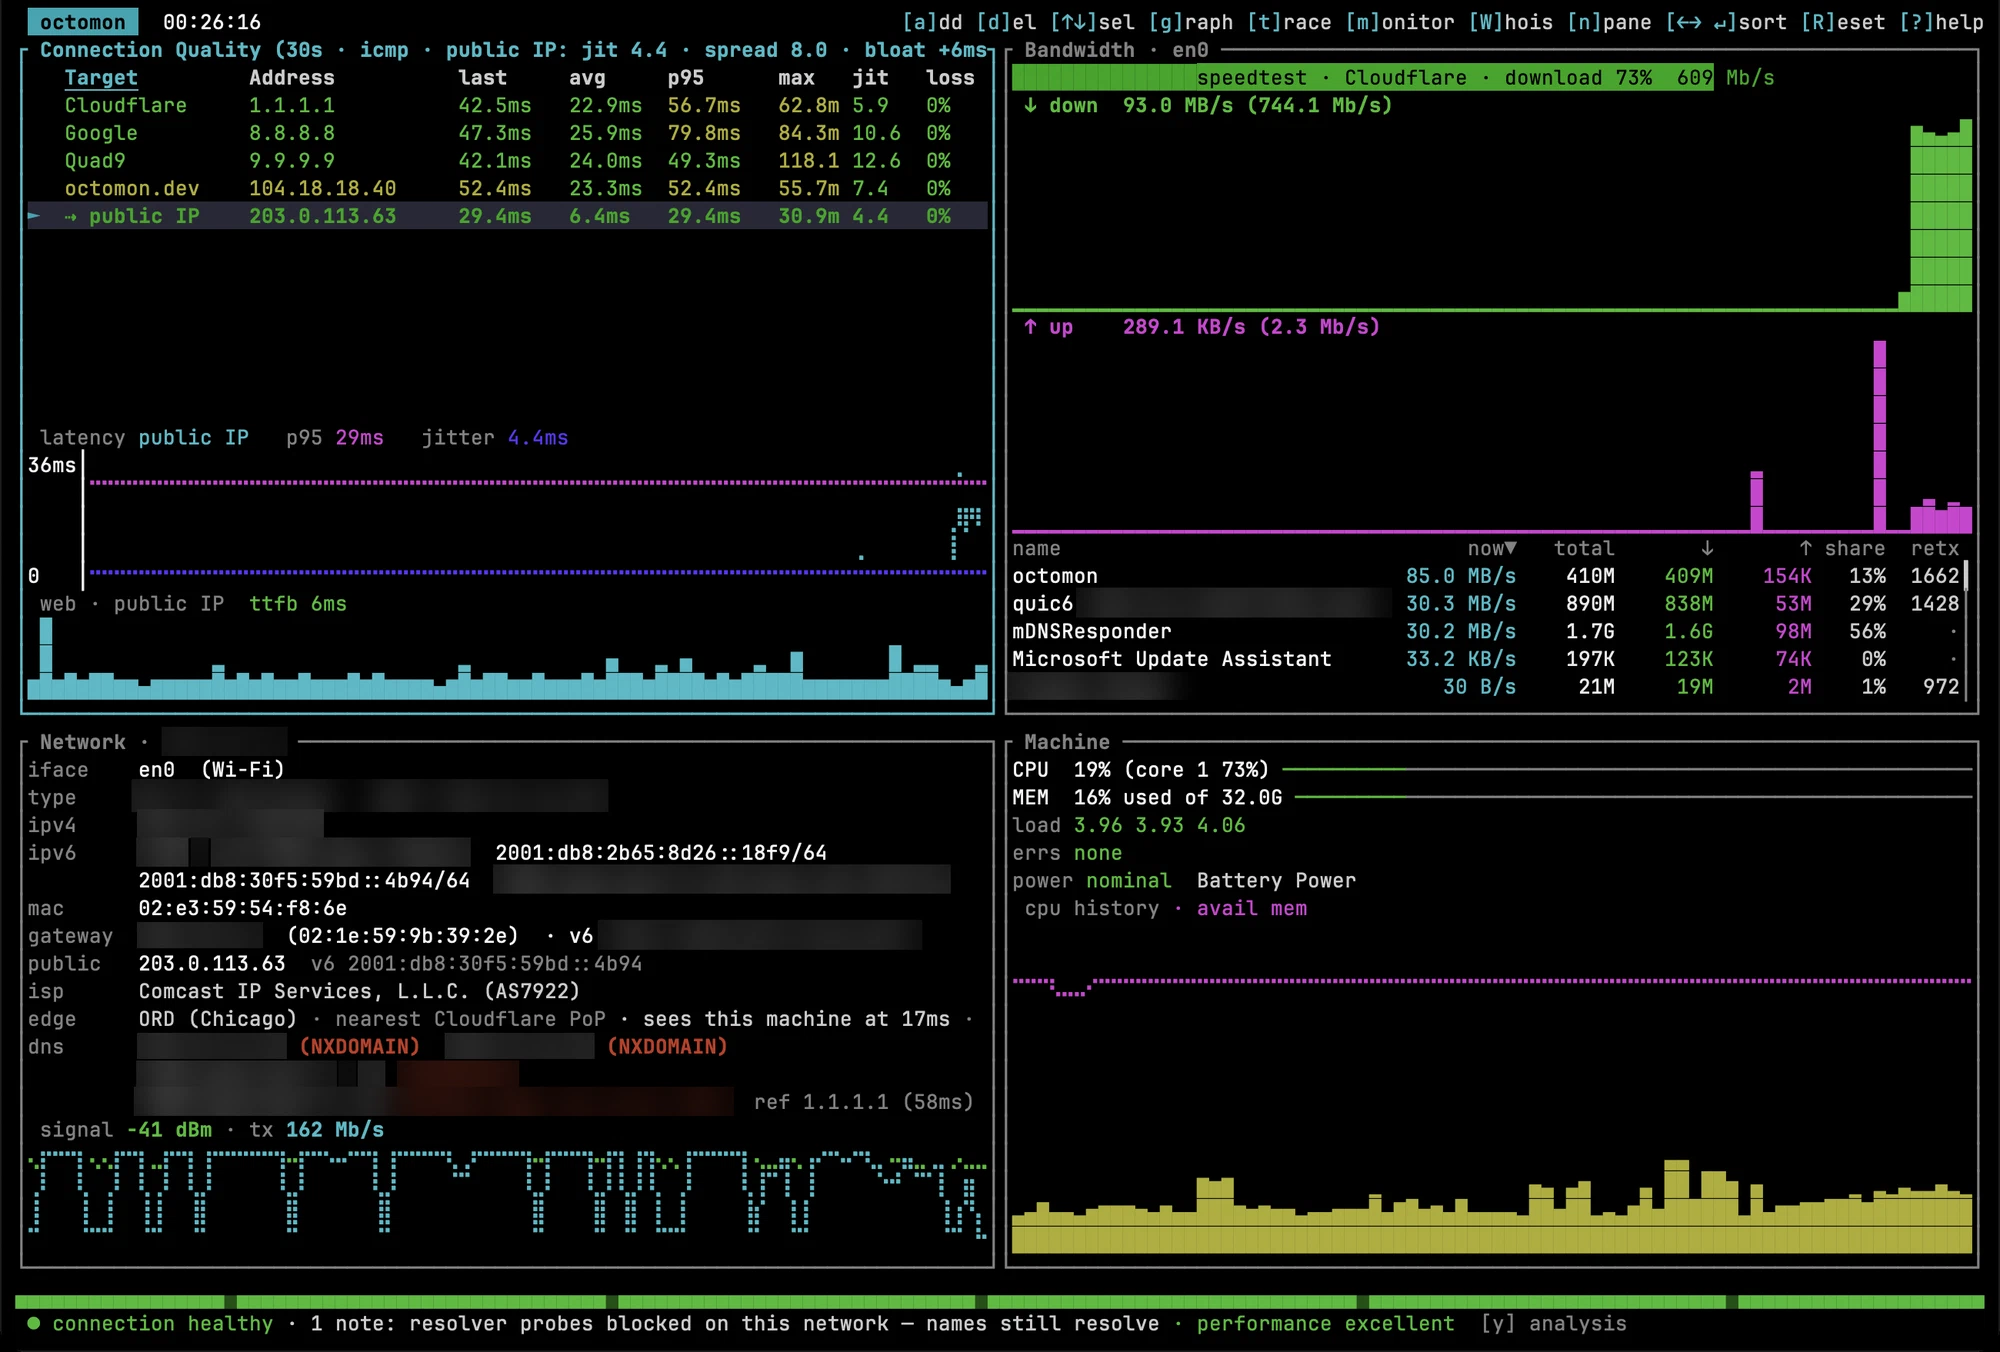
Cloudflare’s test gave me 654 Mb/s down and 39.7 up, with “bloat +45ms (moderate)”. The history view keeps the numbers behind the grade, an idle latency of 49 ms and a loaded latency of 94 ms.
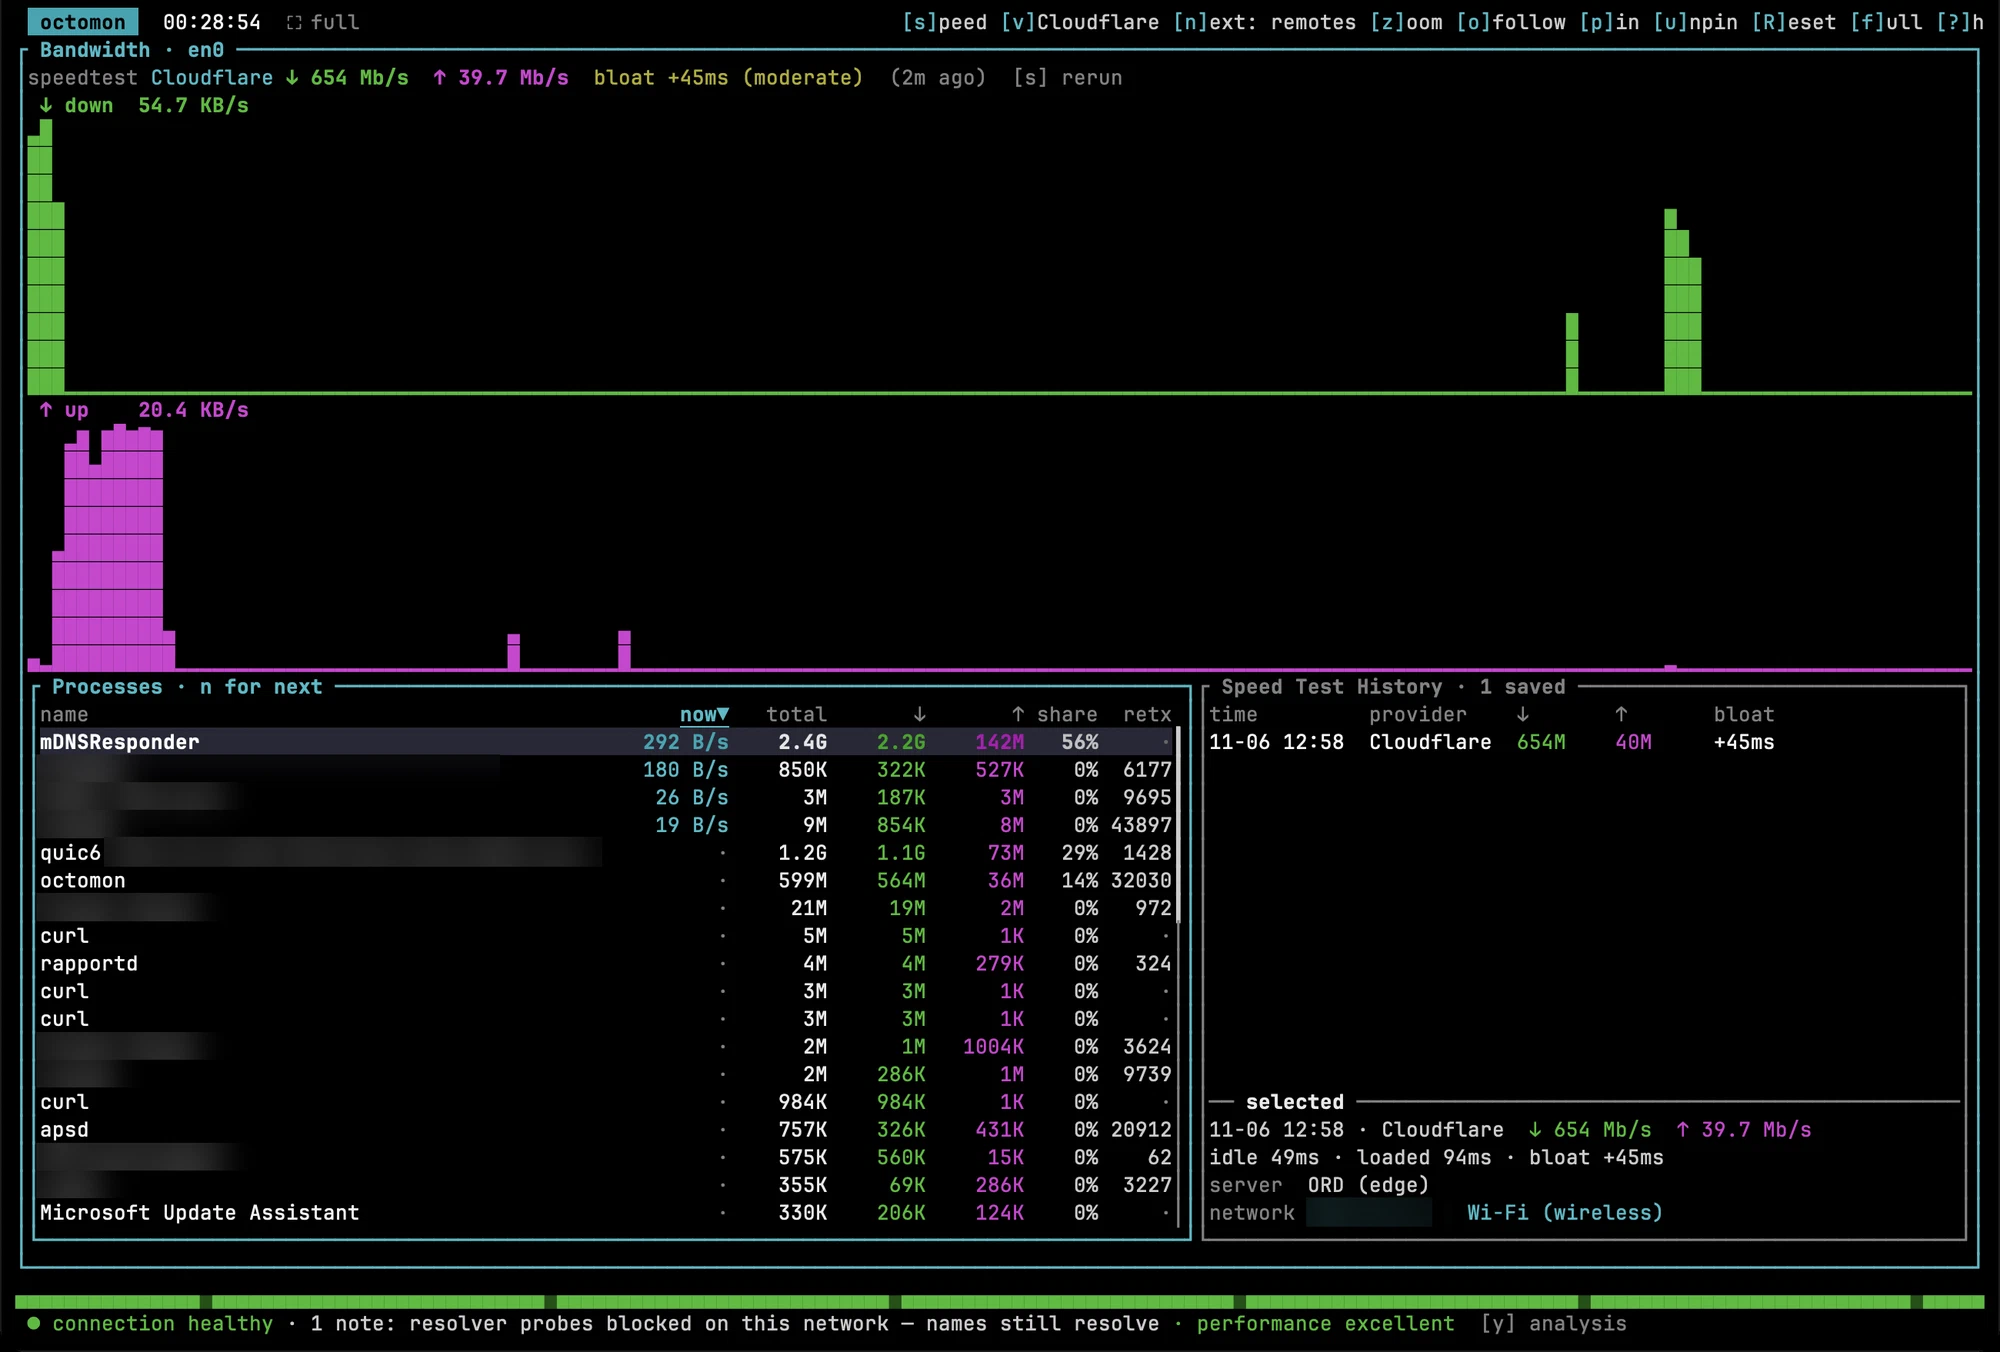
n cycles the panel through three views, per process talkers, remote endpoints and the speed test history. Here’s a 1 GB curl download taking over the process list at 67.5 MB/s, and the same download in the remotes view.
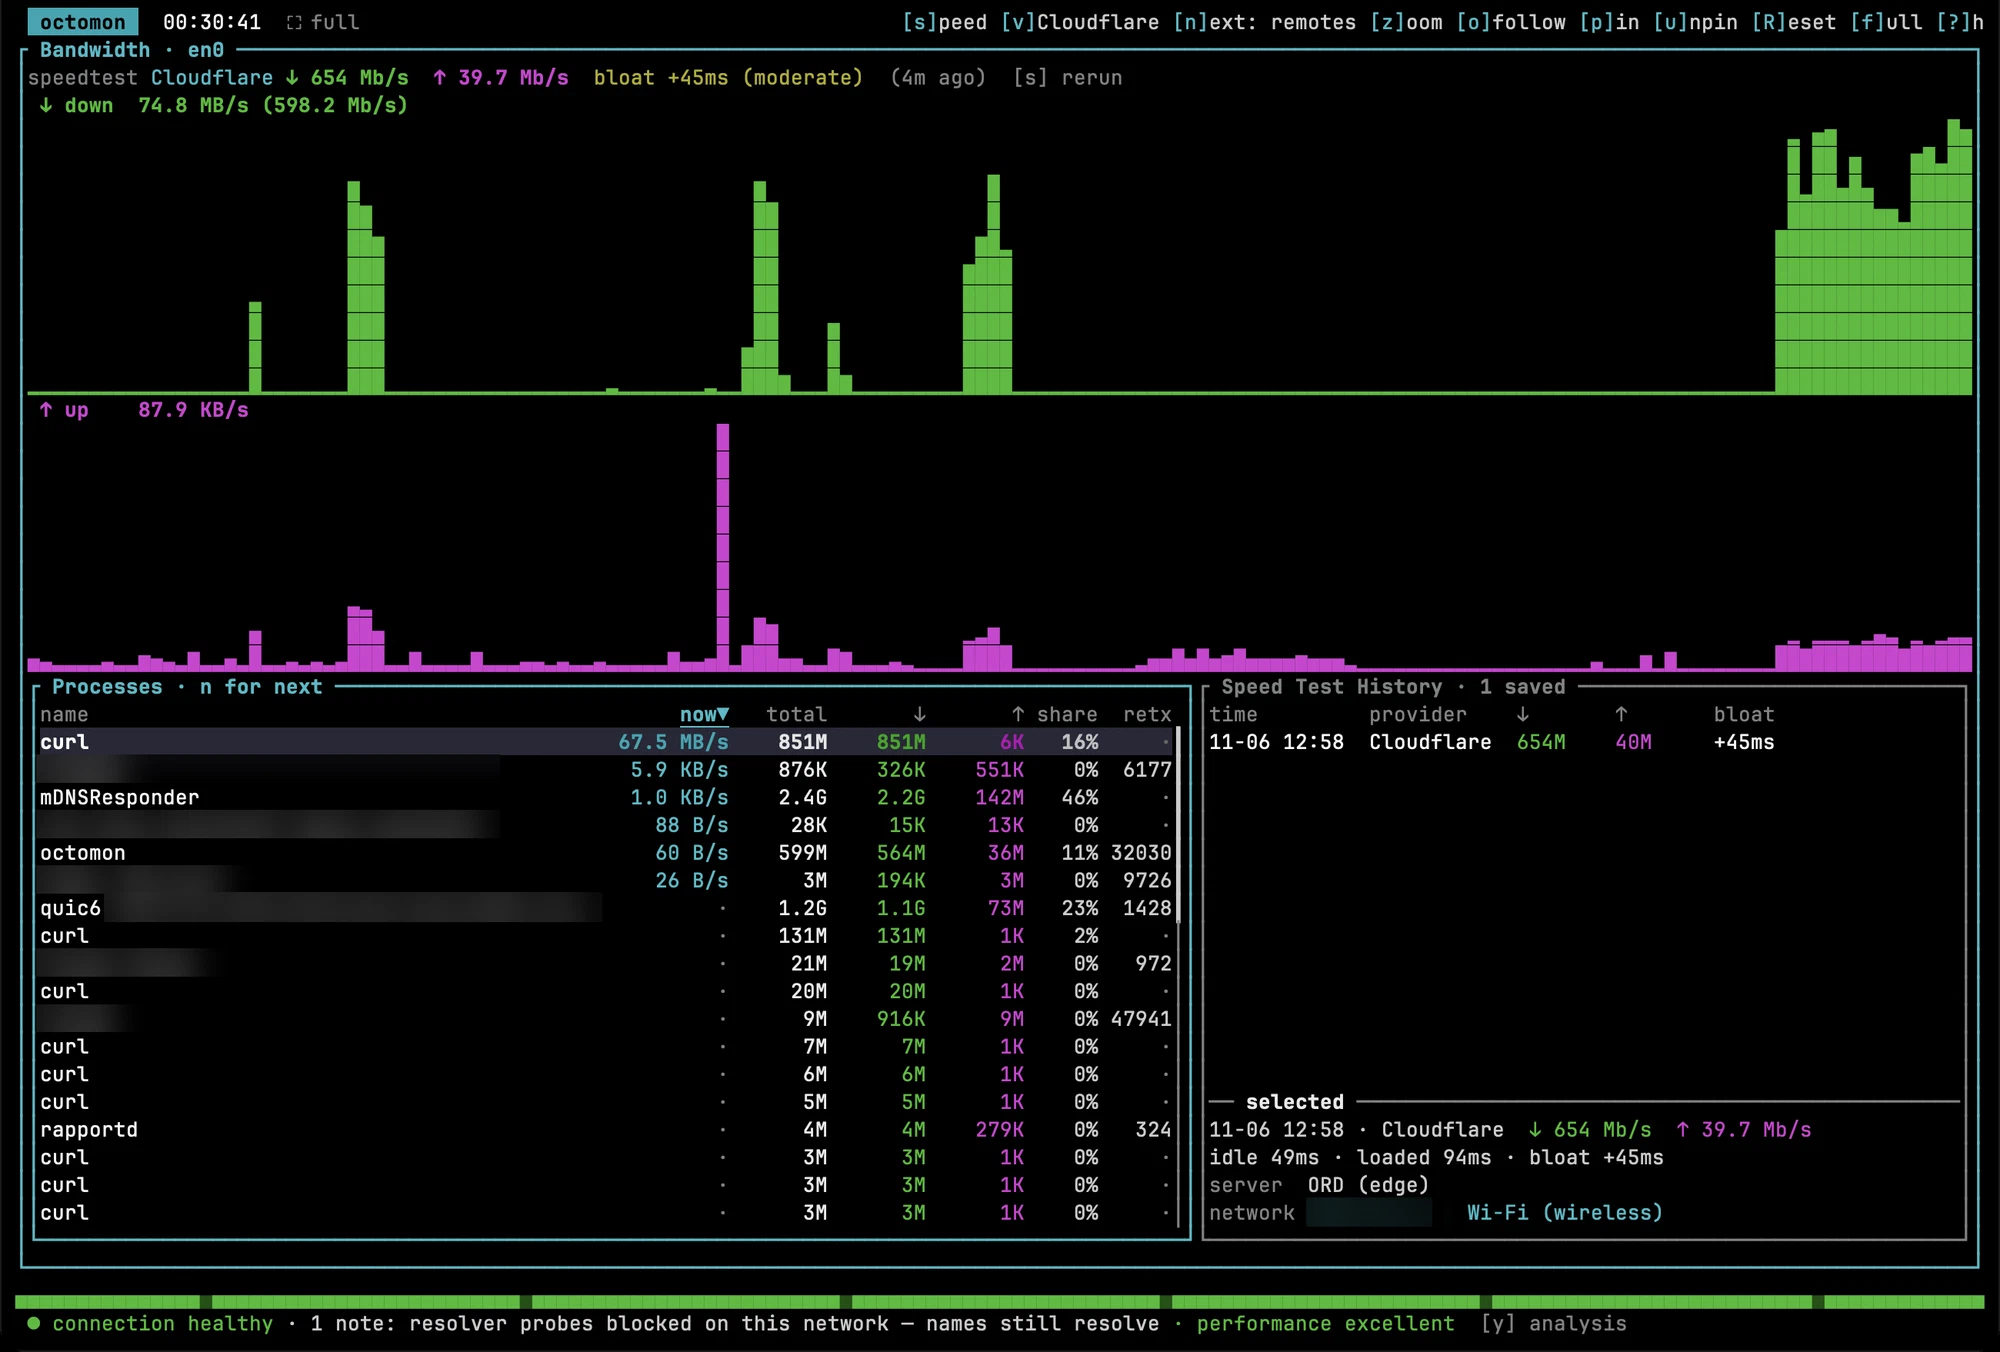
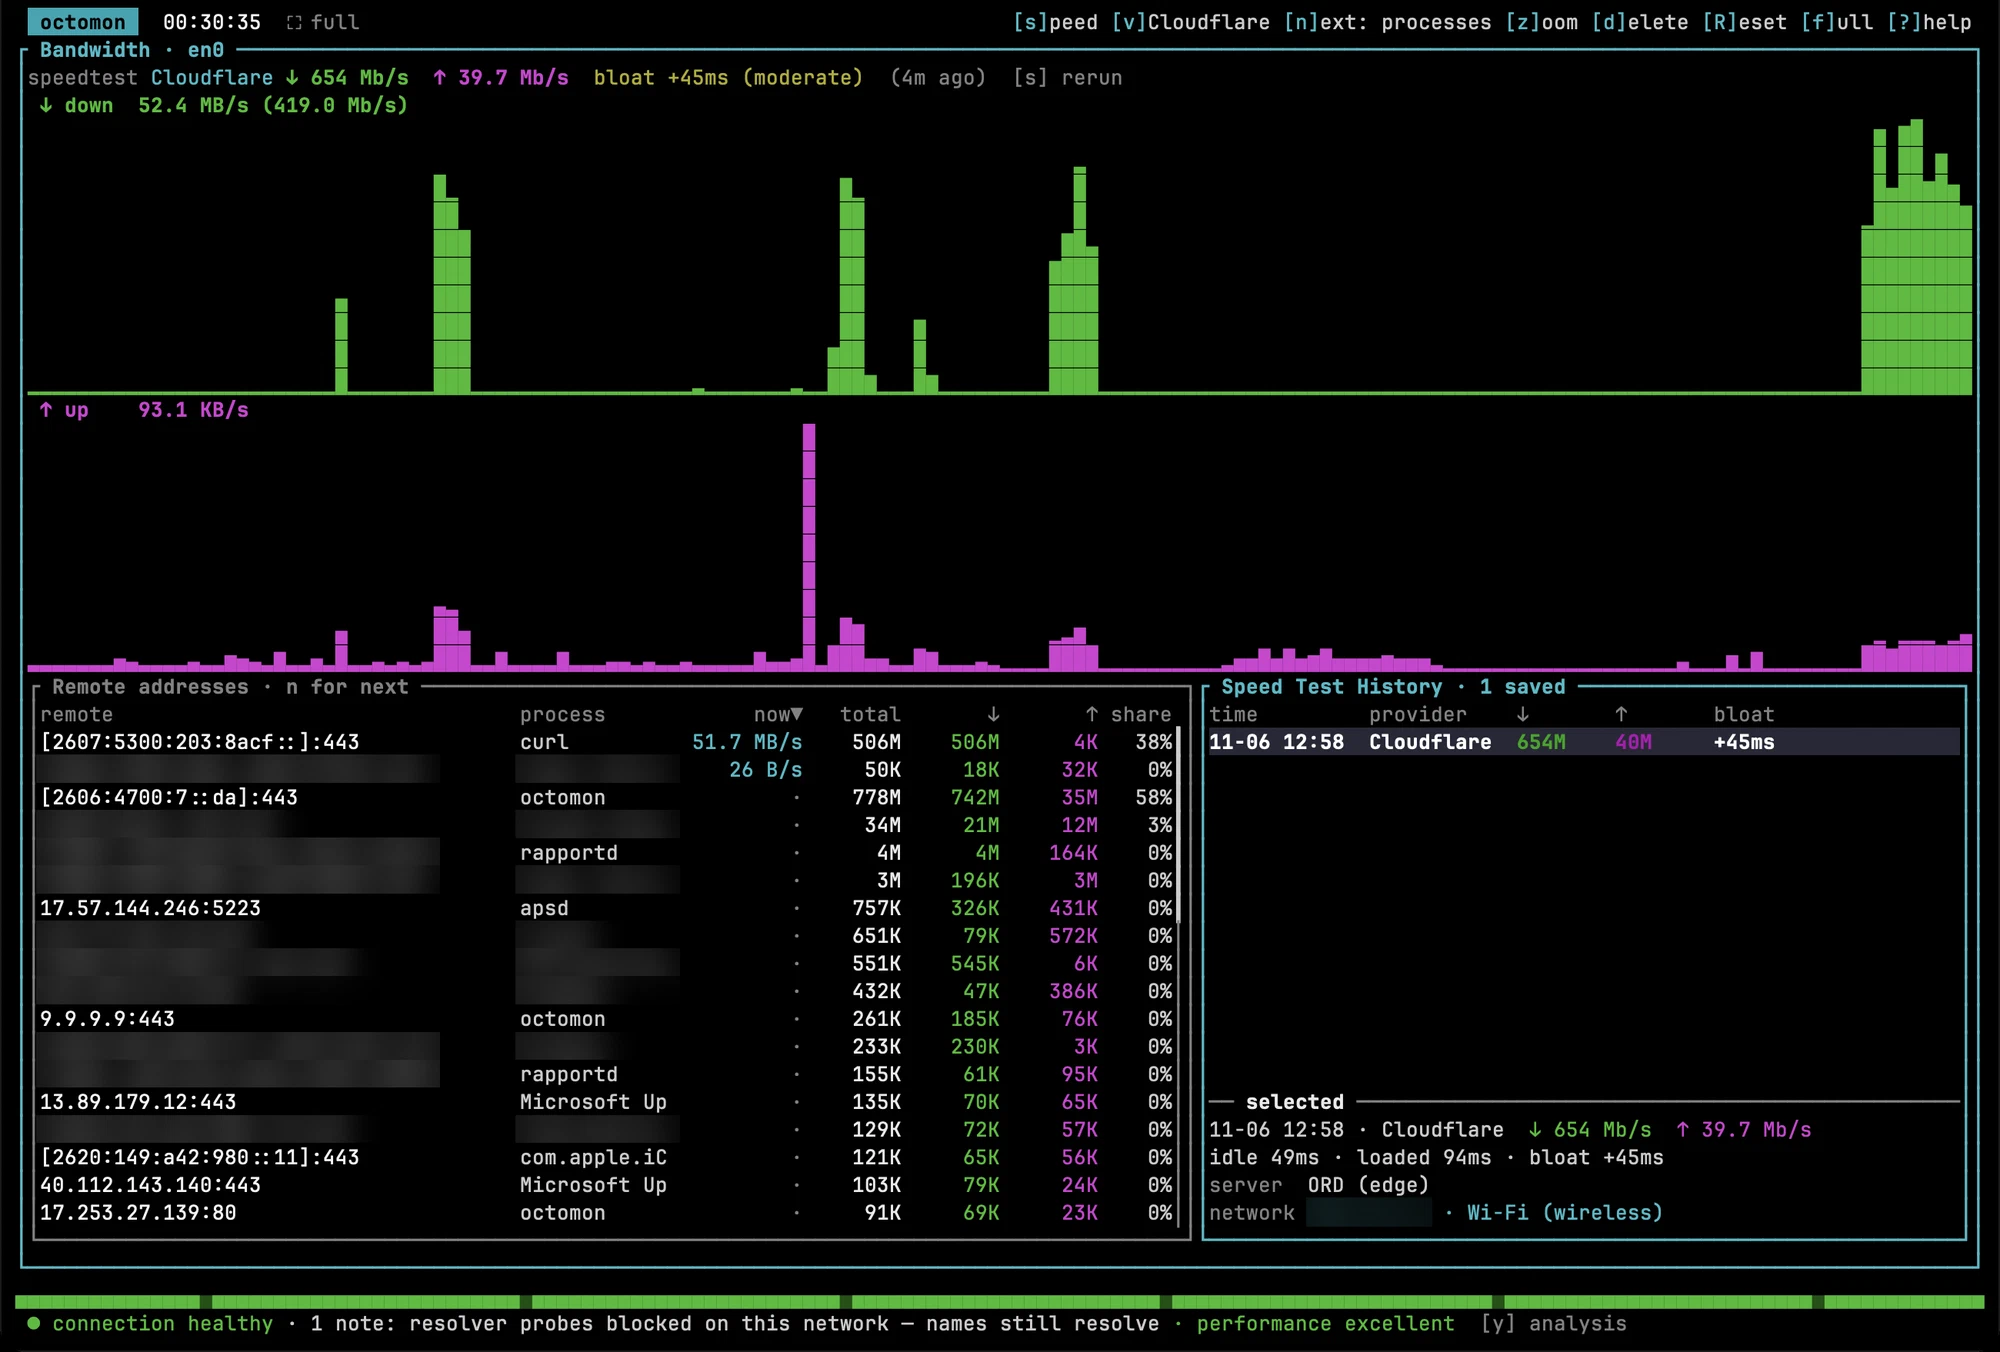
The talkers list shows every process on the machine by name, so it’ll tell anyone looking at your screenshot which apps you run. Use the / filter before you capture it.
The LAN speed test
v cycles the speed test between Cloudflare, M-Lab, LibreSpeed and any iPerf3 servers you’ve added. For me this is the most useful feature in the tool, and the one most likely to fail the first time you try it on a Mac.
Run iperf3 -s on a wired box on your LAN, press I in octomon and add it as name=address. A test against it measures the Wi-Fi and the LAN with the ISP taken out of the picture, and comparing it to the Cloudflare result tells you which side is slow. I pointed it at kaiju, my wired lab box…
speedtest[done] via iPerf3 · kaiju: down=639.0 Mb/s up=395.0 Mb/sAgainst Cloudflare’s 654 down and 40 up, the Wi-Fi carried 639 down and about 400 up. The radio has ten times the upload capacity of the Comcast connection behind it. If my uploads are slow, no access point upgrade is going to fix it.
Getting that number took some work. The first test failed with No route to host, followed by an iperf3 hint about the server stopping or a firewall. Neither was the problem. octomon was running inside tmux, and macOS’s Local Network privacy check blocked the iperf3 it launched from reaching anything on the LAN. Apple’s own binaries are exempt, so ping to the gateway and nc to the server both worked from the same tmux session. Run octomon from a terminal window that has Local Network permission and it works.
The command line way to pick the provider didn’t hold up either. --iperf3 kaiju=<address> --speedtest-provider kaiju is the README’s own example with my names in it, and it ran Cloudflare’s test instead, twice, without a word about why.
Network
The bottom left panel lists the interface, addresses, gateway and every resolver with its response time. Full screen adds the Wi-Fi details (PHY, channel, width), an airspace count of co-channel, overlapping and nearby networks, HTTP reachability over IPv4 and IPv6, a response time chart per resolver, and a sidebar with this location’s history.
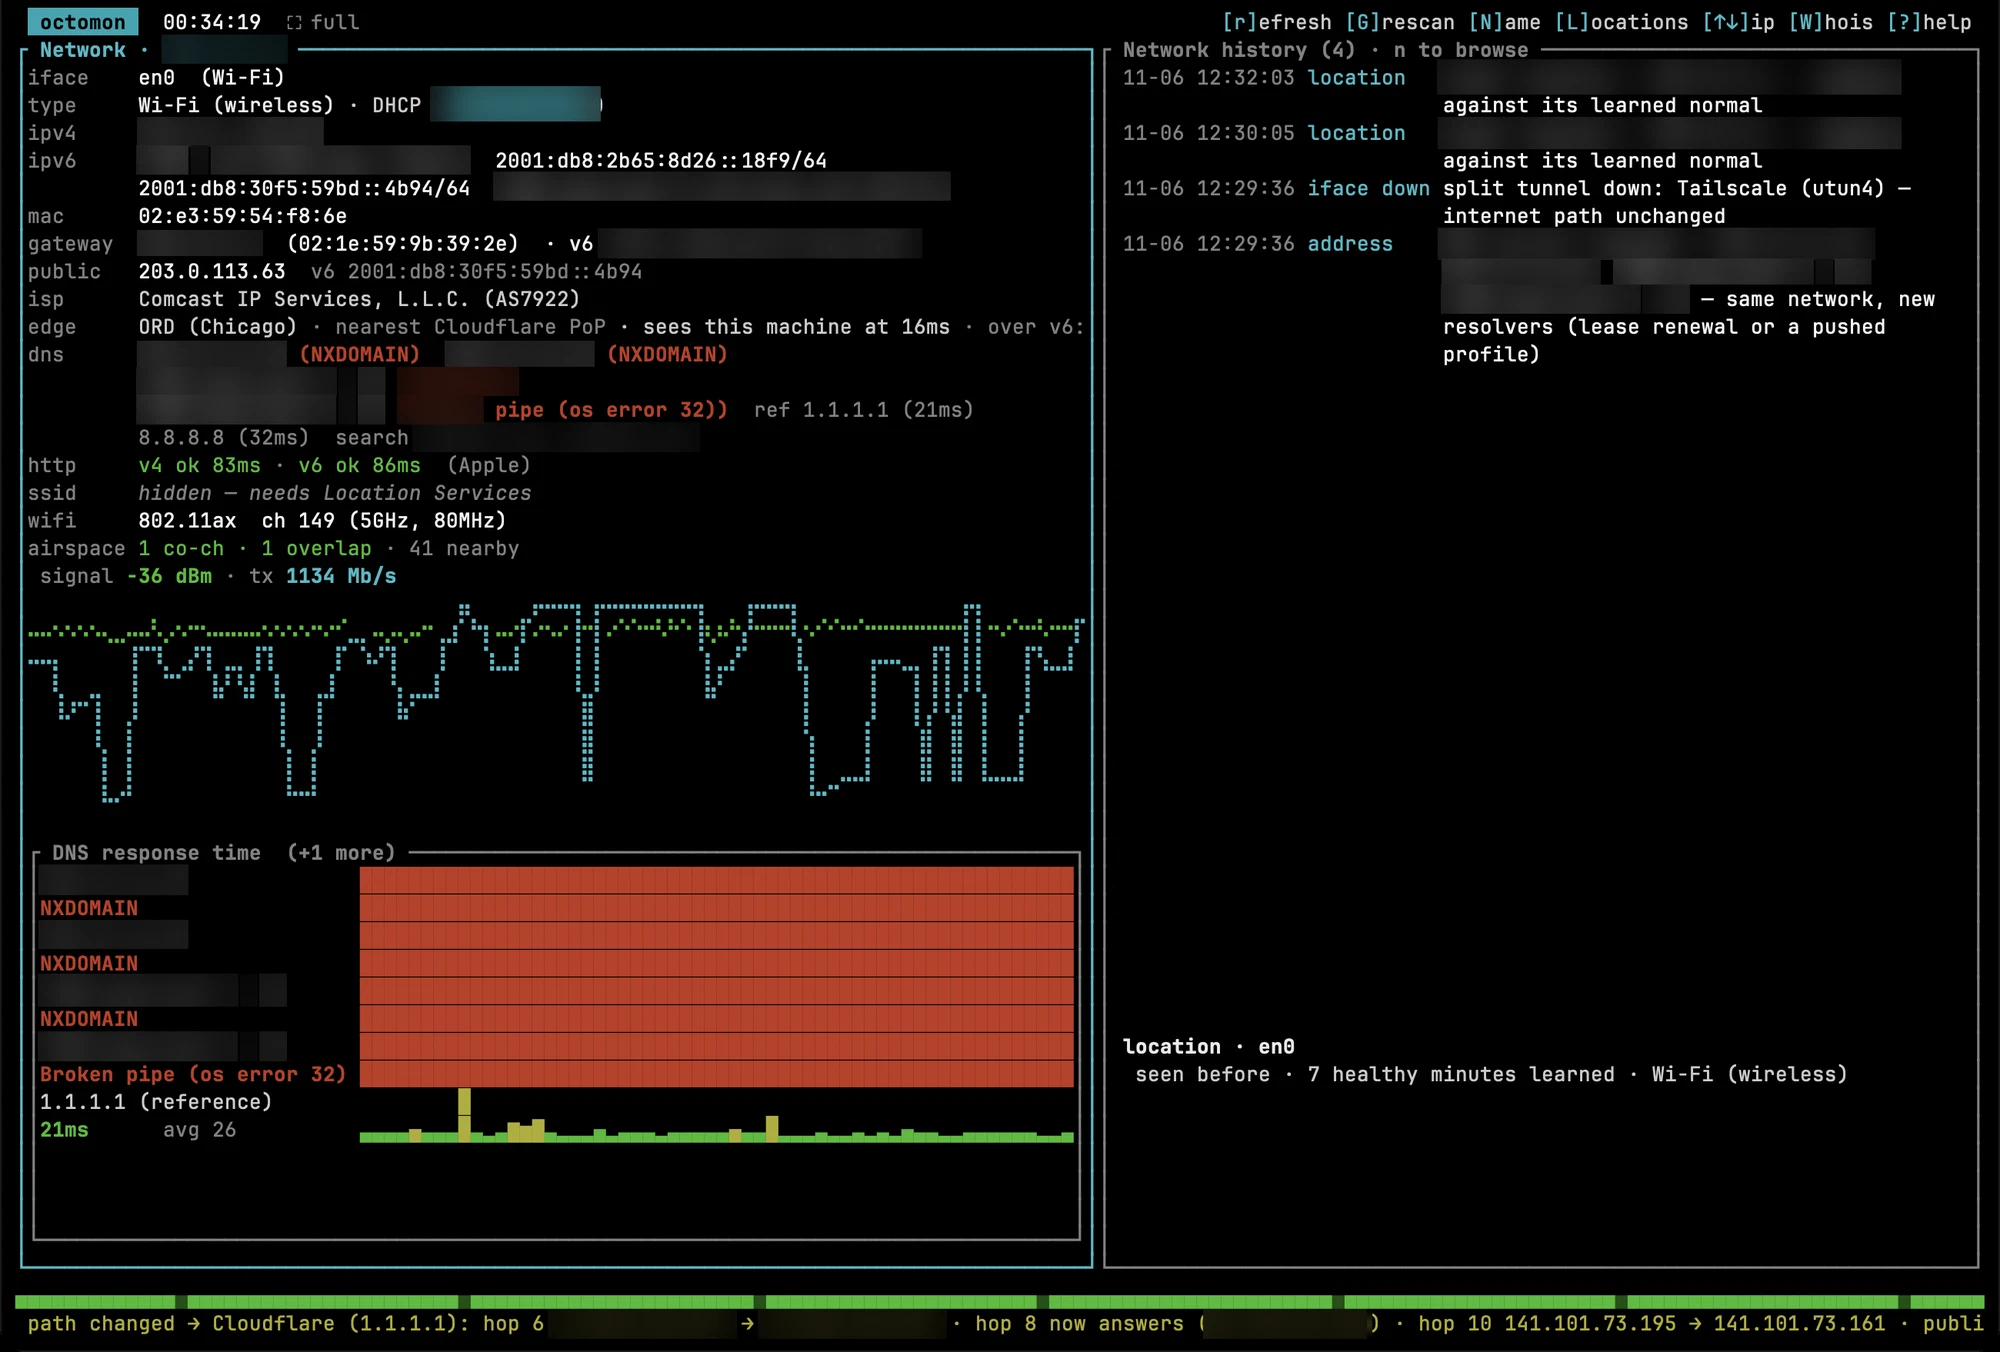
Mine shows every LAN resolver marked (NXDOMAIN). octomon tests resolvers by looking up example.com, and my home resolvers answer NXDOMAIN for that name because of the block lists I run on them. octomon decided resolver probes were “blocked on this network” and carried that as a note for the rest of the session. If your resolvers do anything unusual with example.com, set dns_probe_name in ~/.config/octomon/config.toml to a name they do answer, because the probe result matters a lot in one of the tests below.
The N key names the current network and L lists the locations octomon has learned, each with its own baseline.
Machine
The bottom right panel answers the question network people forget to ask, which is whether the laptop itself is the problem. It shows the busiest core, memory pressure, load average, interface errors and thermal state.
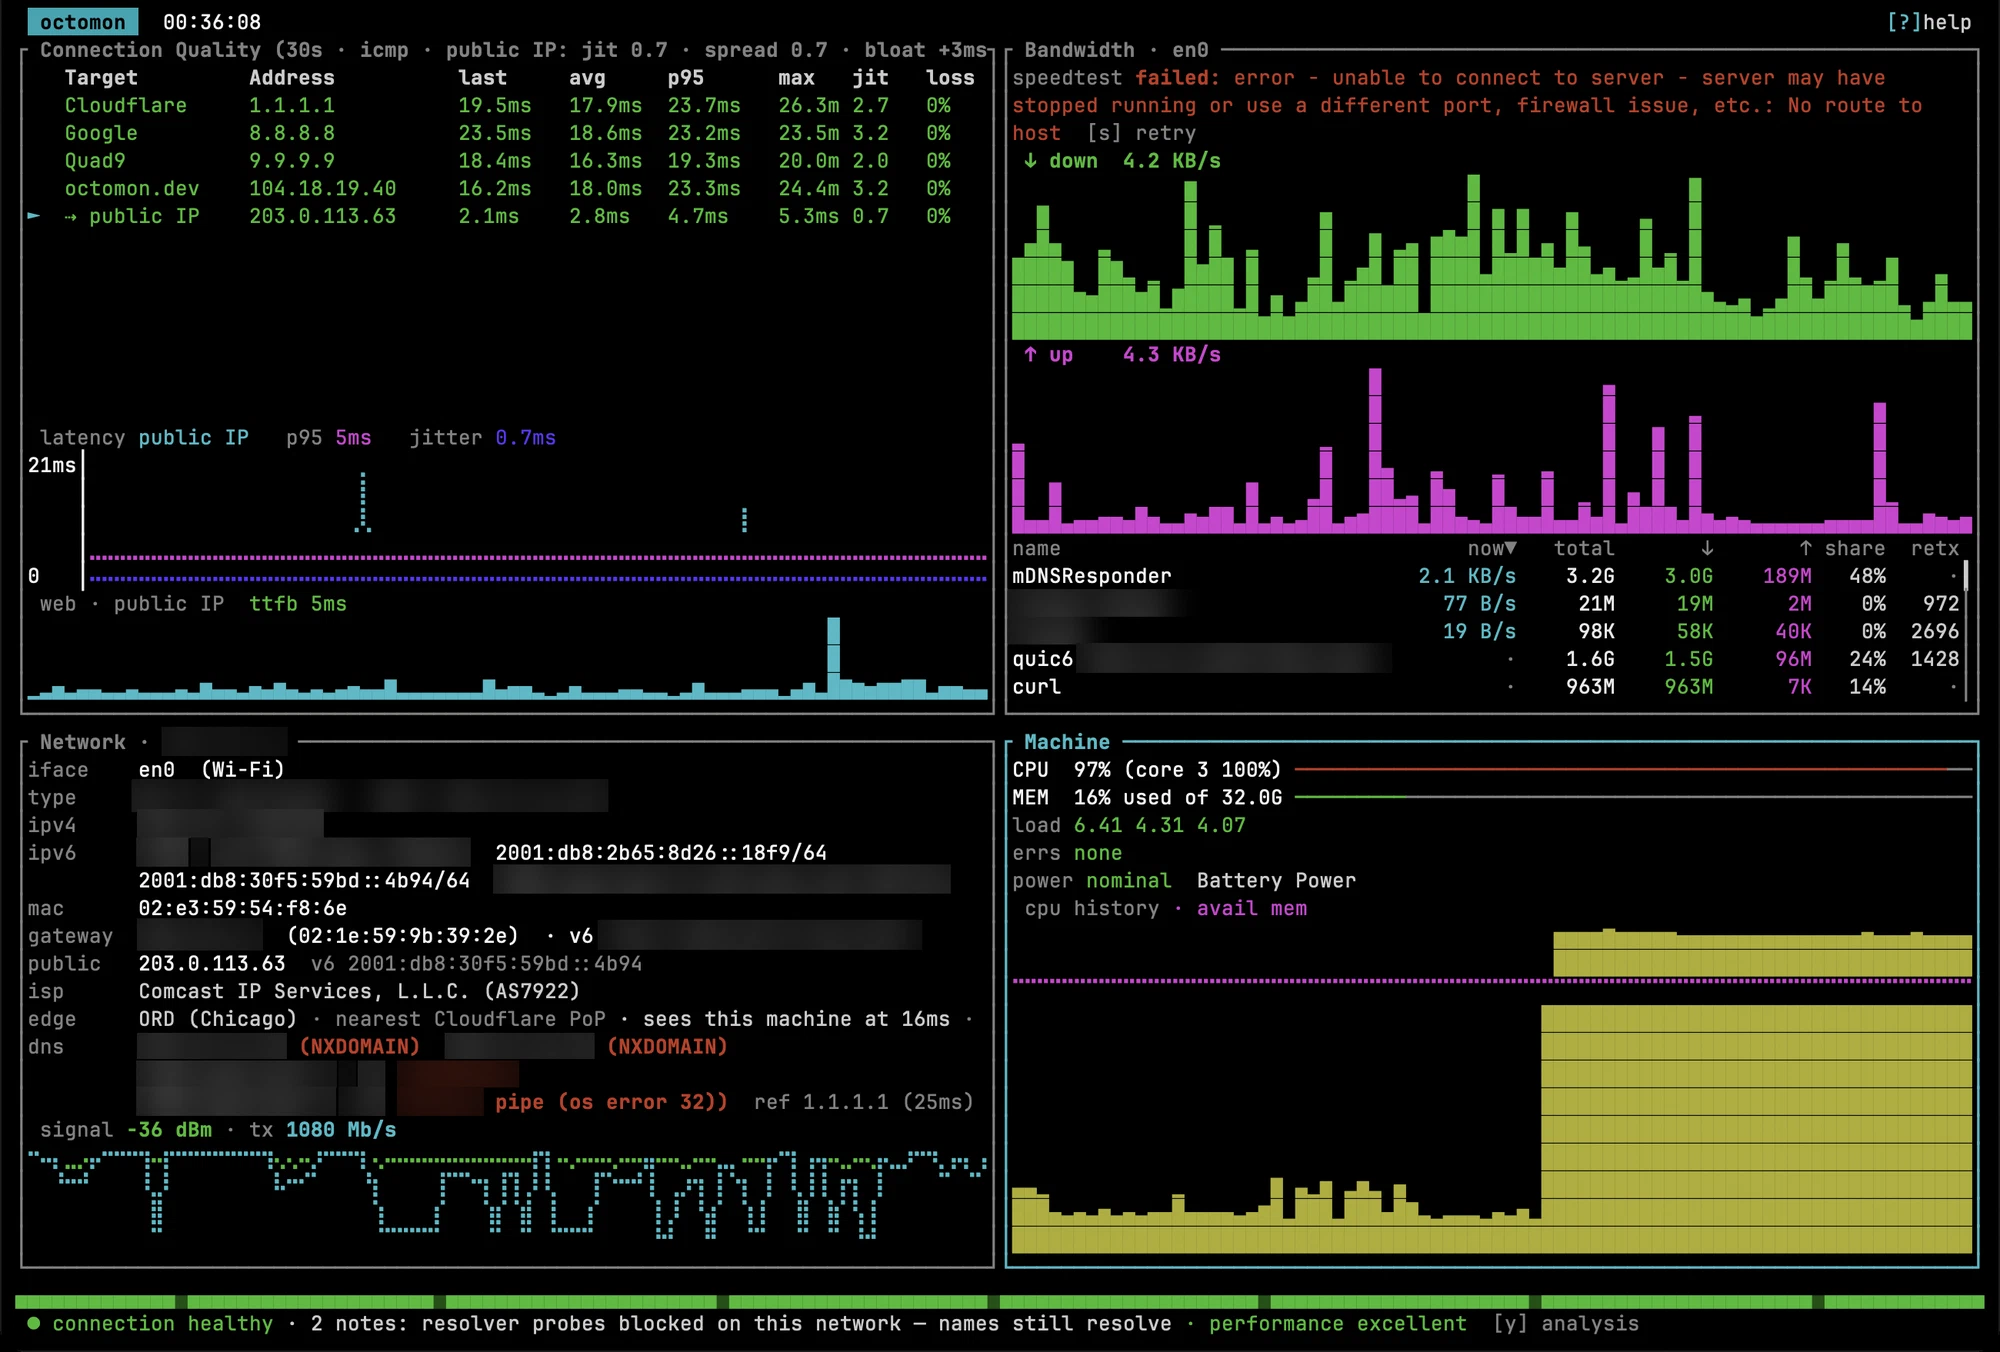
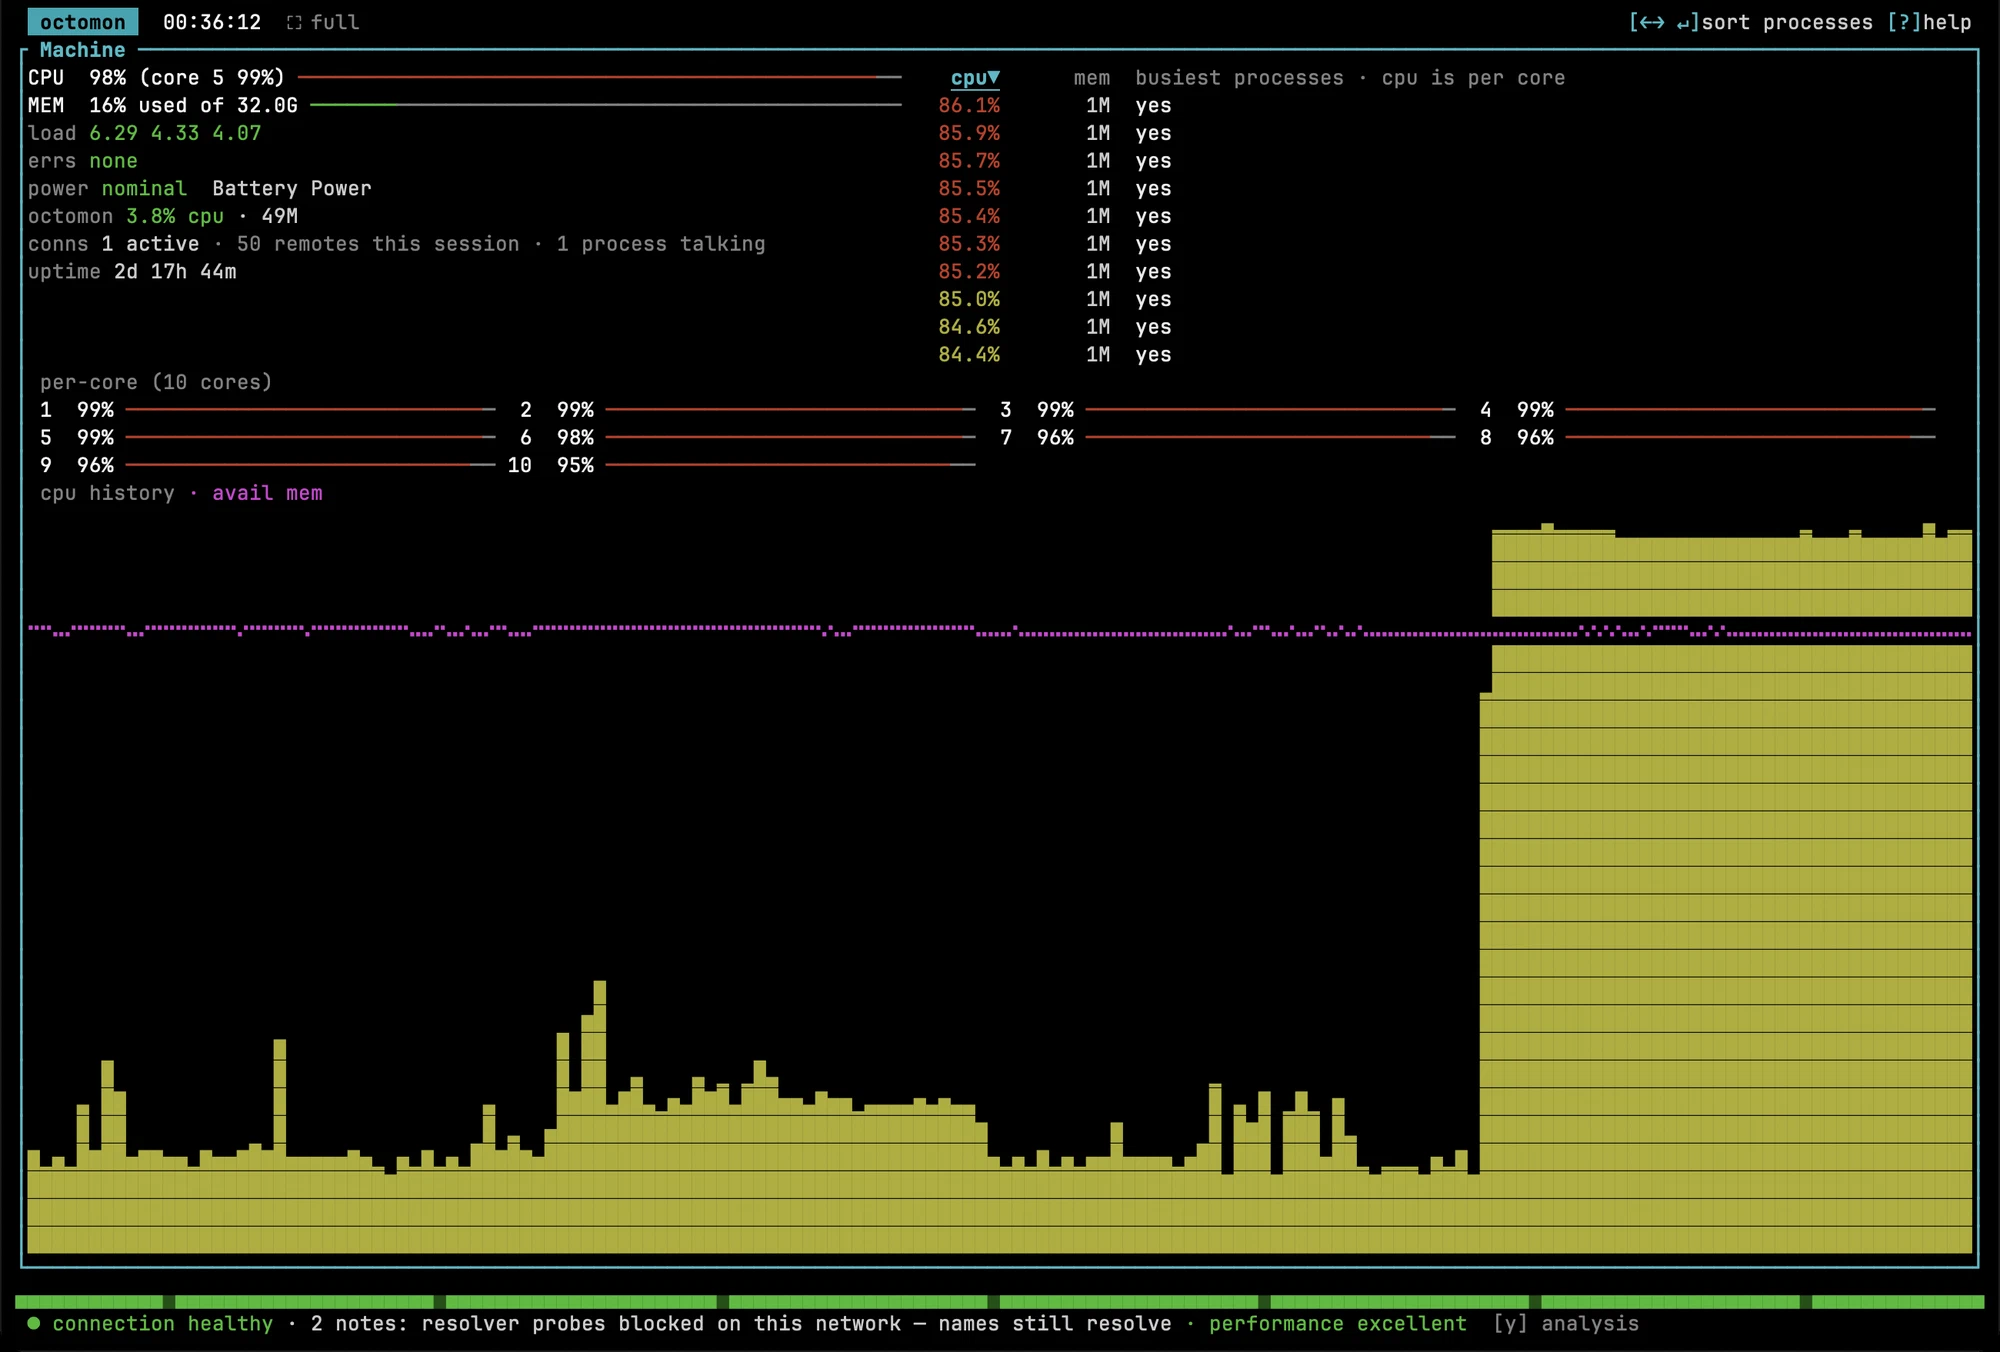
I pinned all ten cores with yes > /dev/null. The full screen view named the yes processes at about 85 percent each, and also showed what octomon costs to run (3.8 percent CPU and 49 MB).
The verdict line and the triage ladder
The line at the bottom of the screen is the whole point of the tool. It reads ● connection healthy most of the time, and changes when octomon finds something, along with how long it’s been going on.
y opens the triage ladder behind the verdict. It walks from your machine outward (machine, link, gateway, DNS, ISP path, internet, web, destinations), then runs a list of checks like edge, public IP, NAT, clock, proxy, path MTU and whether your resolvers lie about names that don’t exist. Every rung shows its evidence, including the healthy ones.
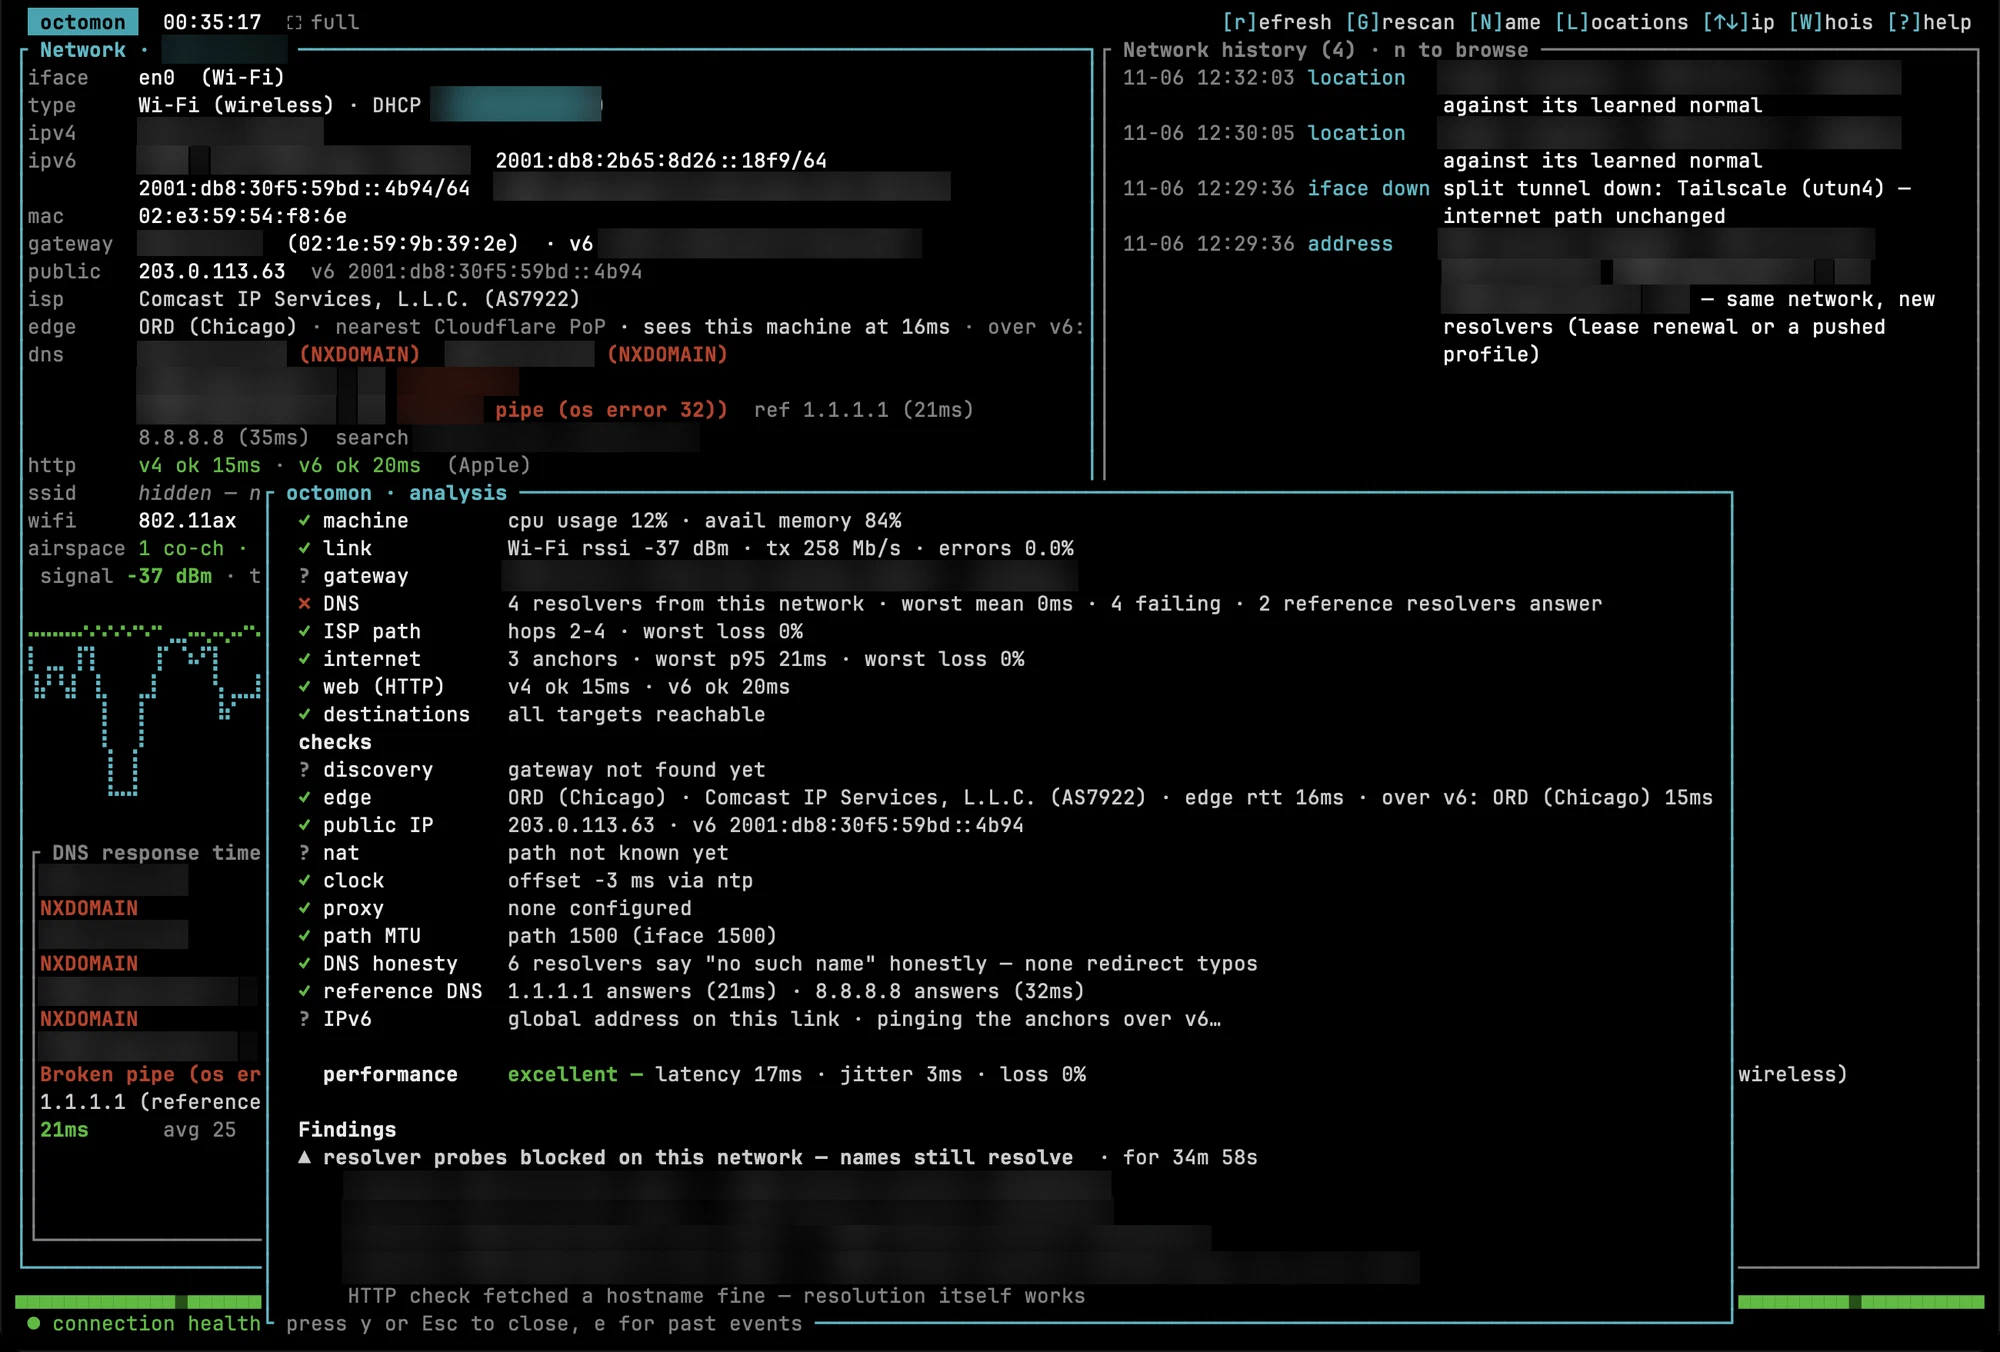
The grading is relative. octomon builds a baseline per network, keyed by the SSID and the gateway’s MAC, so the coffee shop gets judged against the coffee shop and home against home. It won’t compare a new network against its normal until it has learned about five healthy minutes there, and a finding has to show up on four of six evaluations in a row before it’s raised, then stay quiet for a while before it clears. A flapping link doesn’t produce a flapping verdict.
Under CPU load, the ladder did the right thing. The verdict stayed connection healthy and the load showed up as a note, with a finding of ▲ machine under load (cpu 98%) on the machine rung. A busy laptop is a caveat sitting next to a network verdict, and octomon treated it that way.
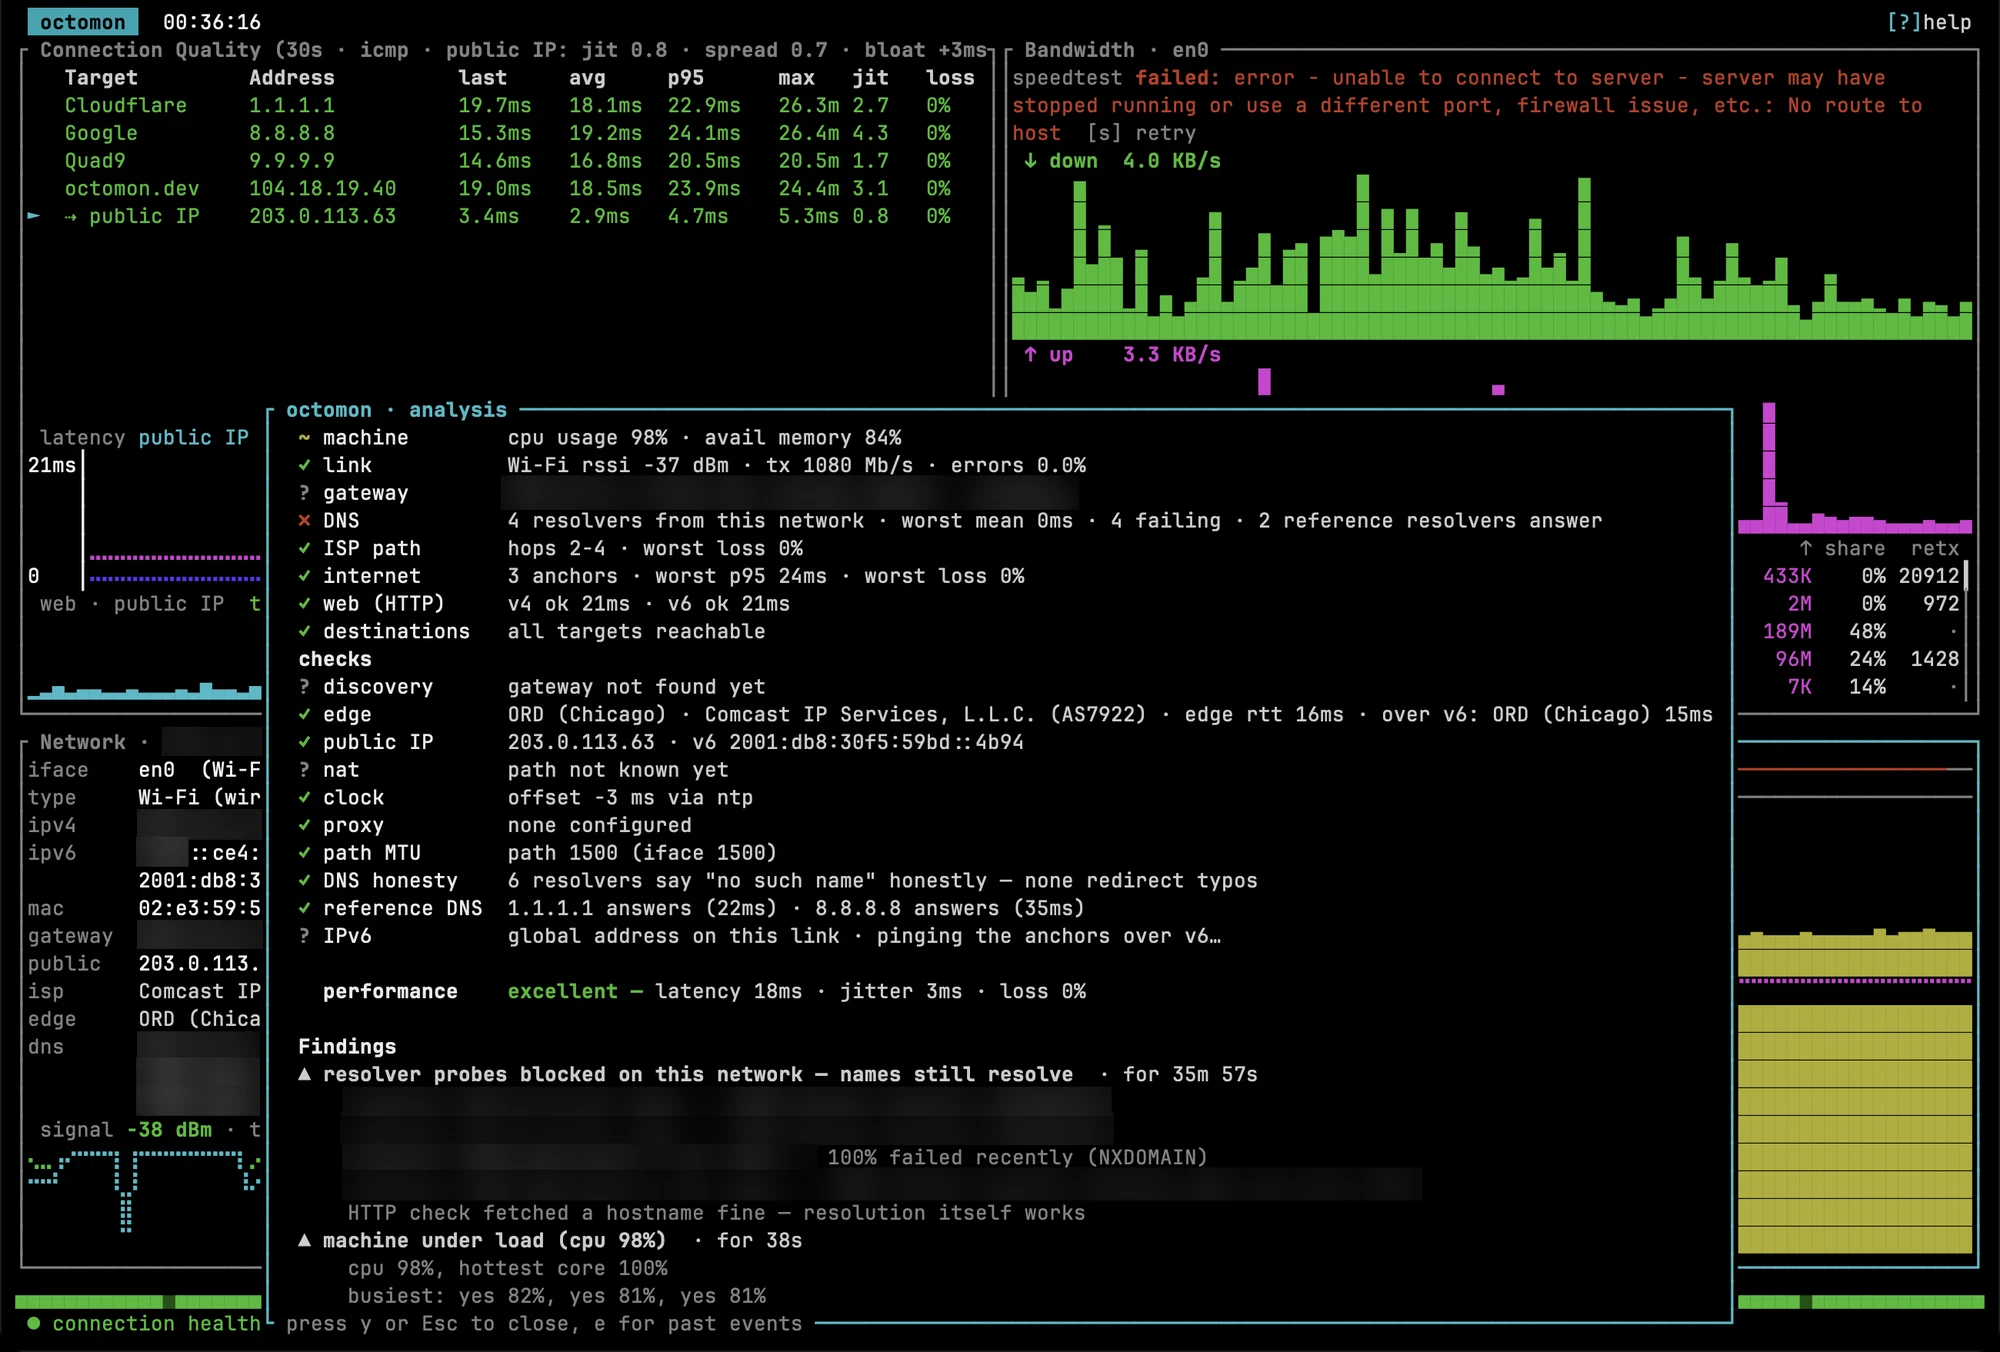
The finding was raised about five seconds after the load started. The ladder dropped it about 15 seconds after the load stopped, and the events timeline logged the end about 50 seconds later, after the quiet stretch.
Breaking things on purpose
I wanted to know how often the verdict line gets it right, so I let octomon learn the house for an hour and then went looking for trouble. All of this ran on the same MacBook over the same Wi-Fi.
A VPN coming up
I brought Tailscale up. Within a second the events timeline logged a split tunnel on utun4, noted that internet traffic still leaves via Wi-Fi, and recorded the resolver change to Tailscale’s MagicDNS. No false alarm, and the right layer. When I took it down, it logged that too, with “internet path unchanged.”
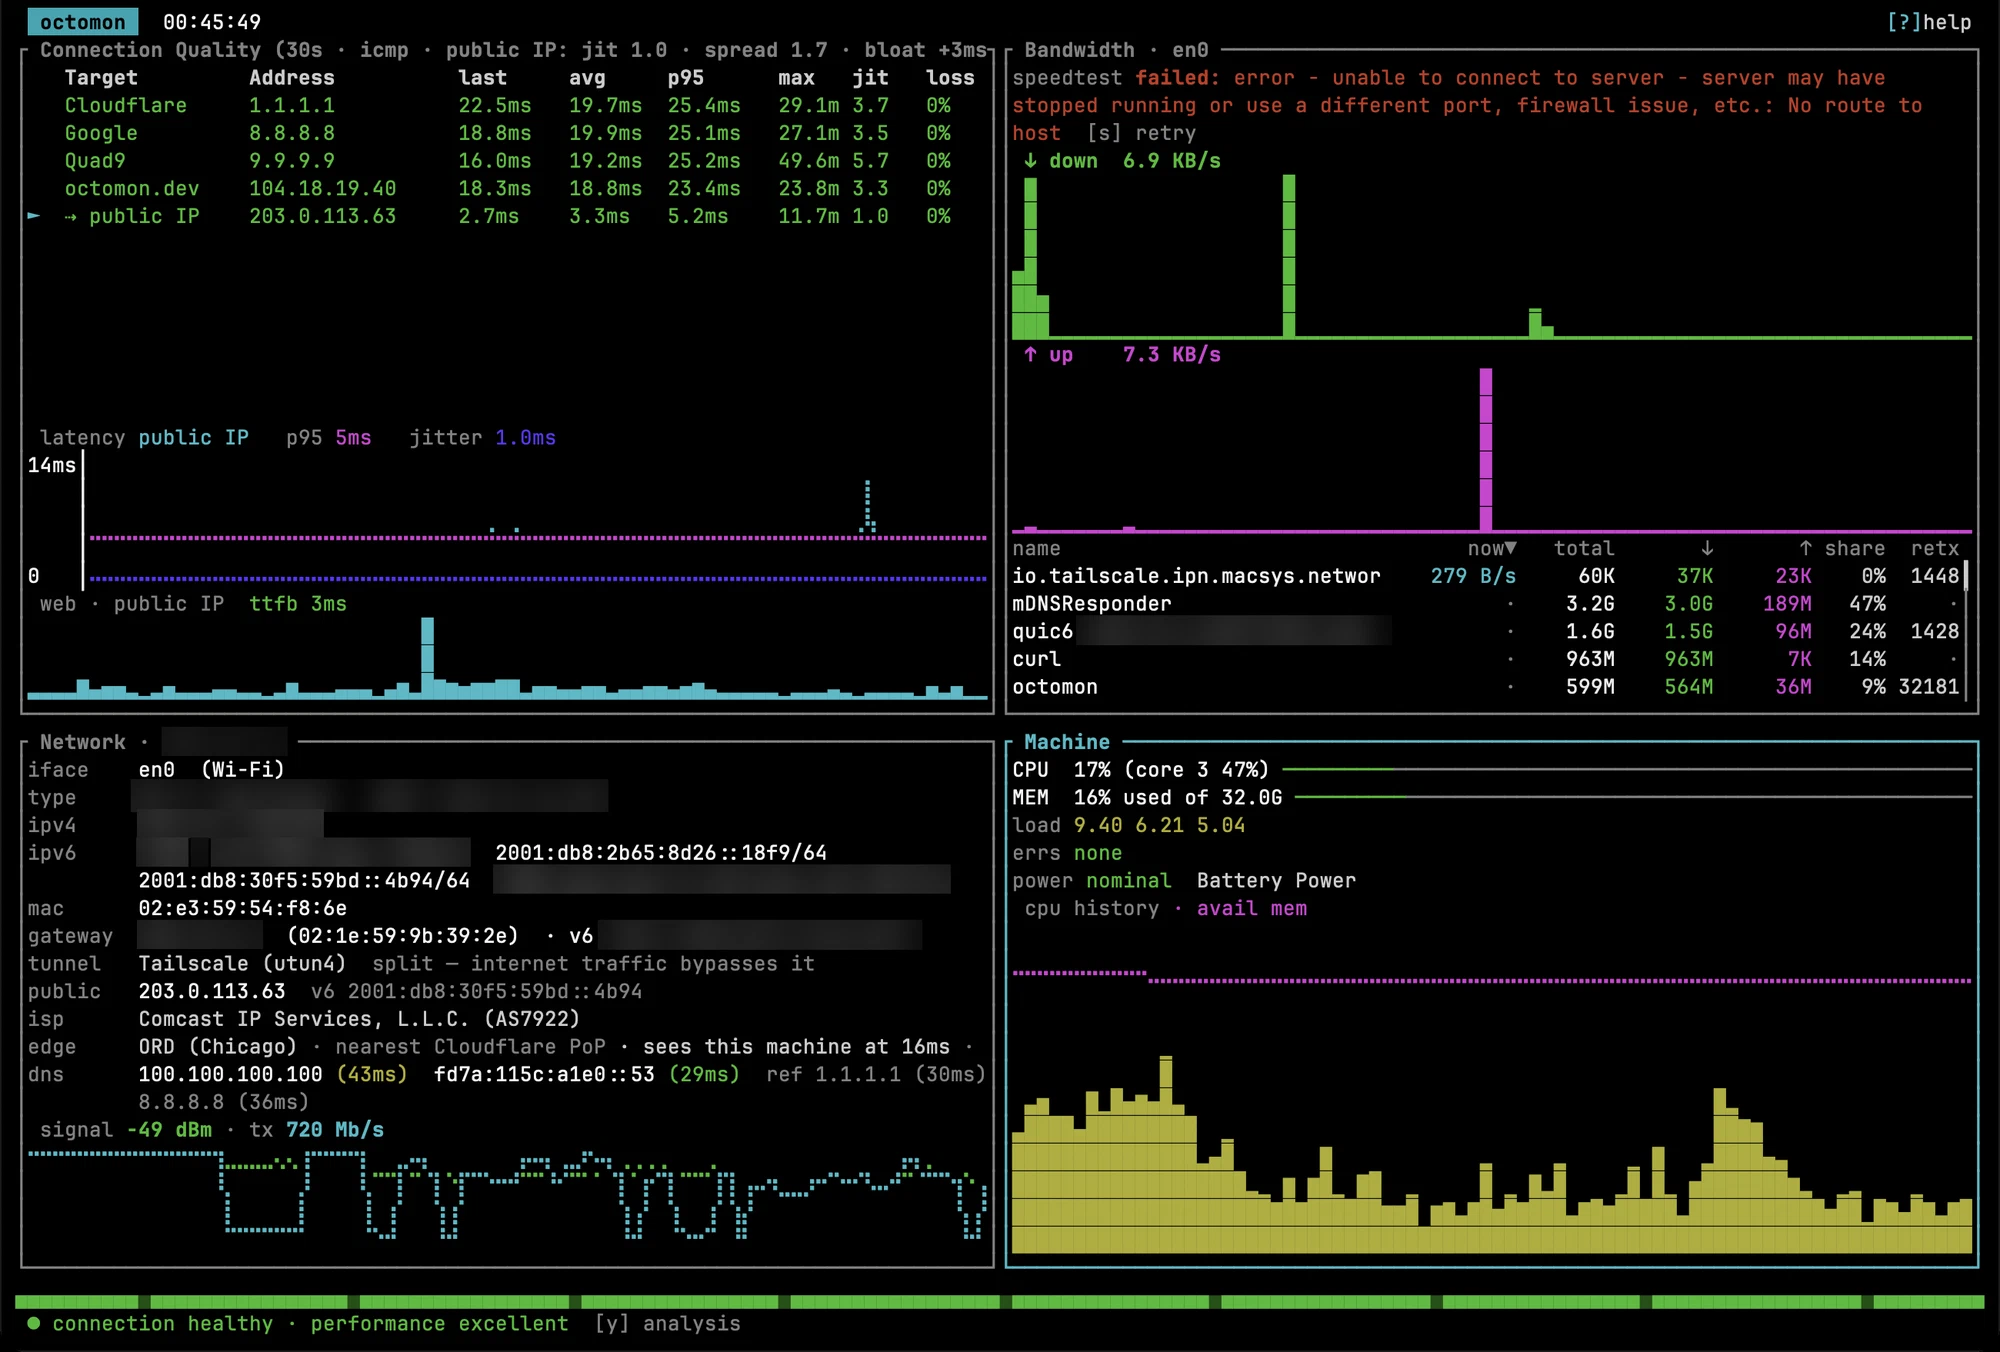
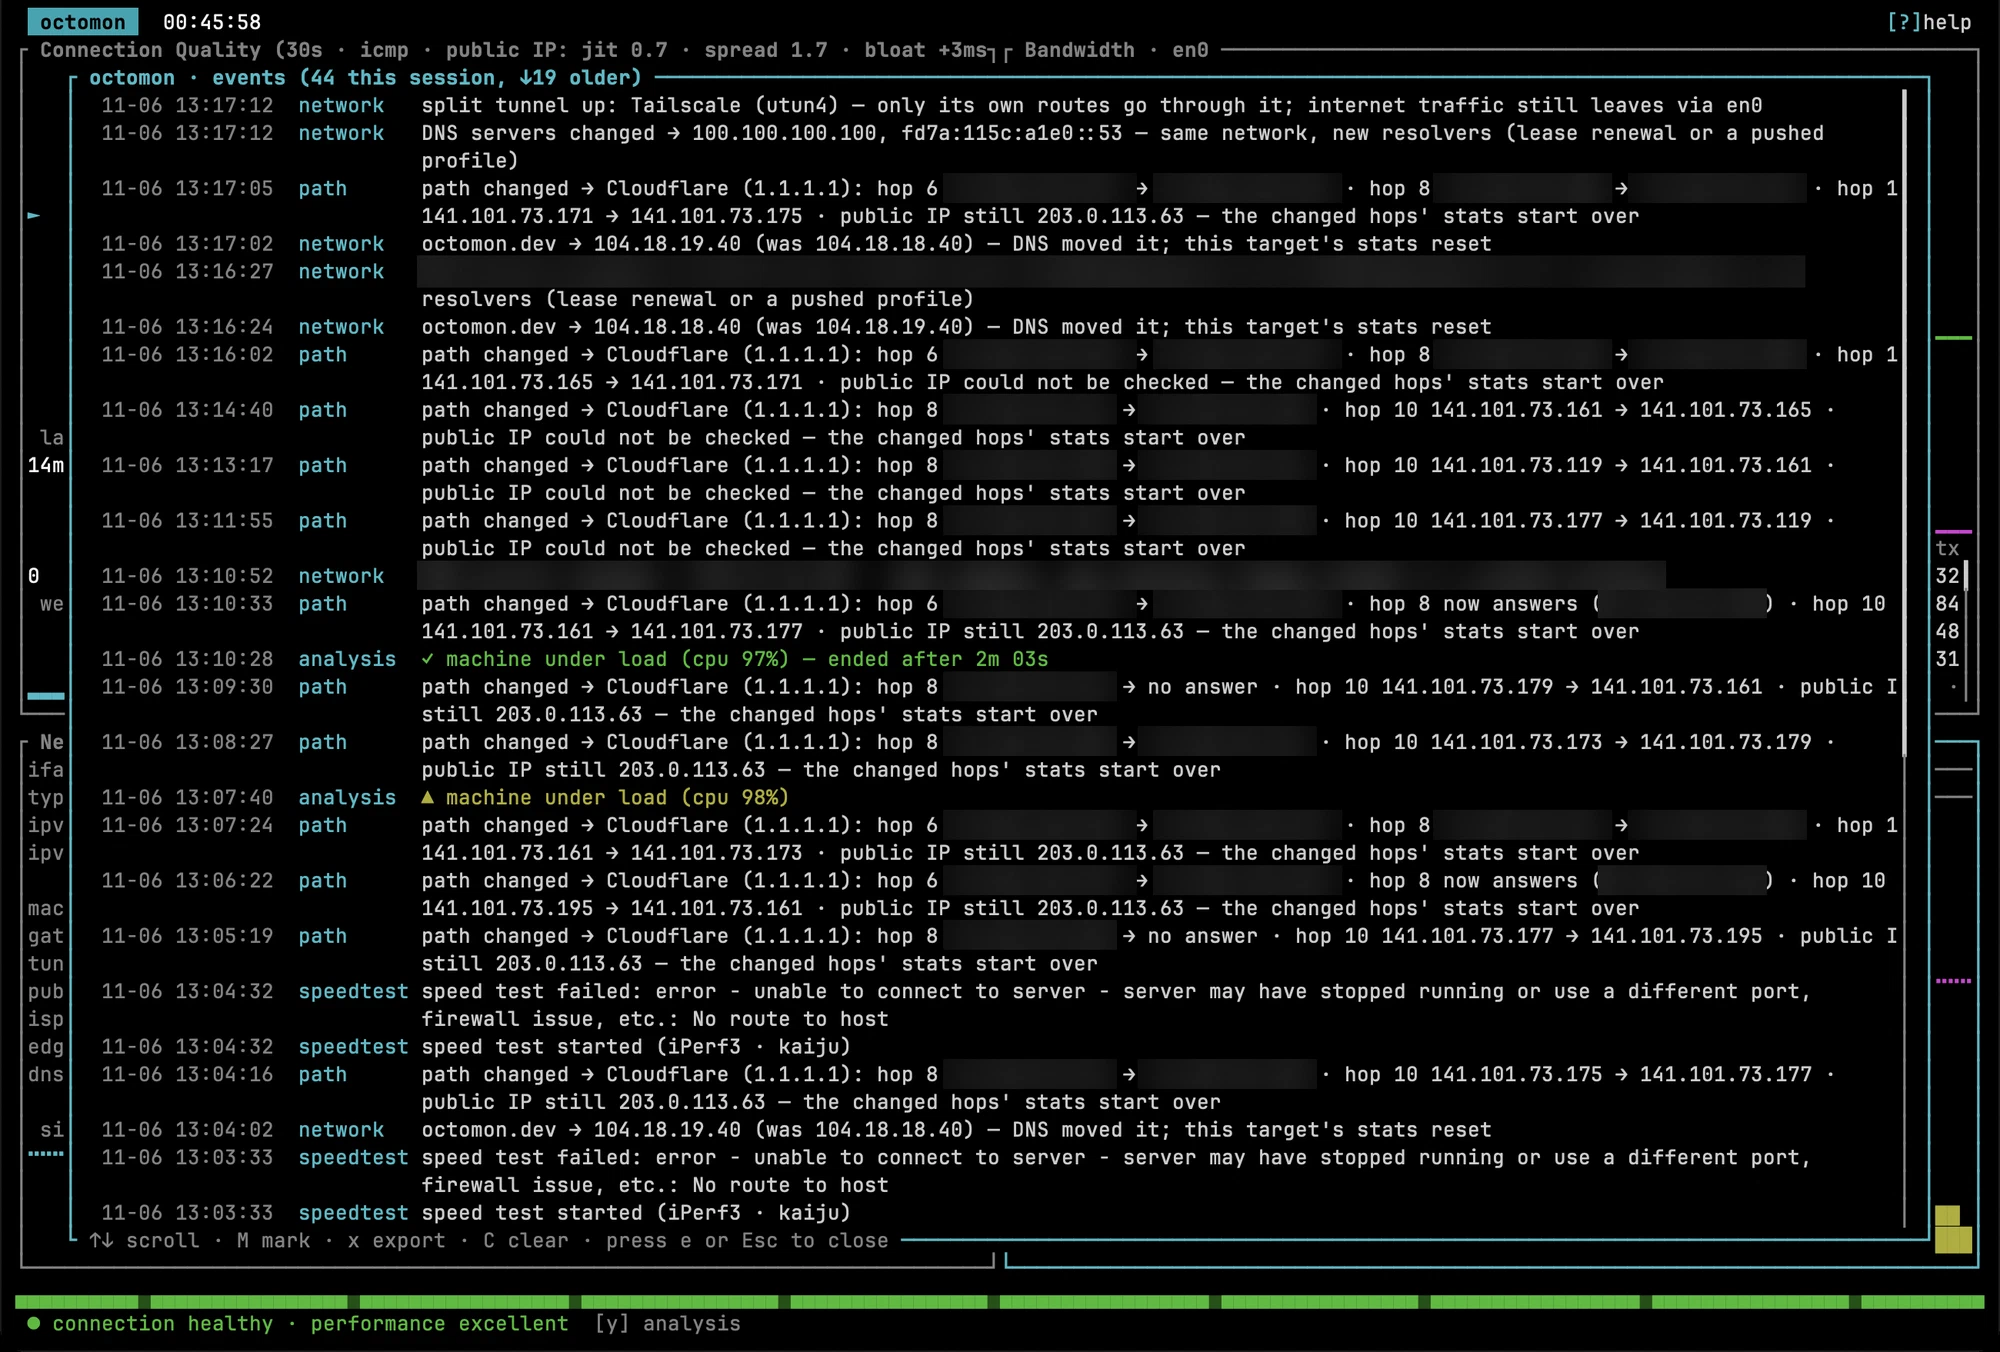
The “probes blocked” note on my resolvers went away while Tailscale was up. My tailnet uses split DNS, which sends internal names to my home resolvers and everything else to a public resolver, so example.com resolved normally.
A dead DNS server
I set the Mac’s DNS to an unused address on the LAN, so every lookup timed out. Nothing on the machine could resolve a name, and the browser couldn’t load a page.
For the five and a half minutes the resolver was dead, octomon’s verdict read ● connection healthy · 1 note: resolver probes blocked on this network — names still resolve · performance excellent.
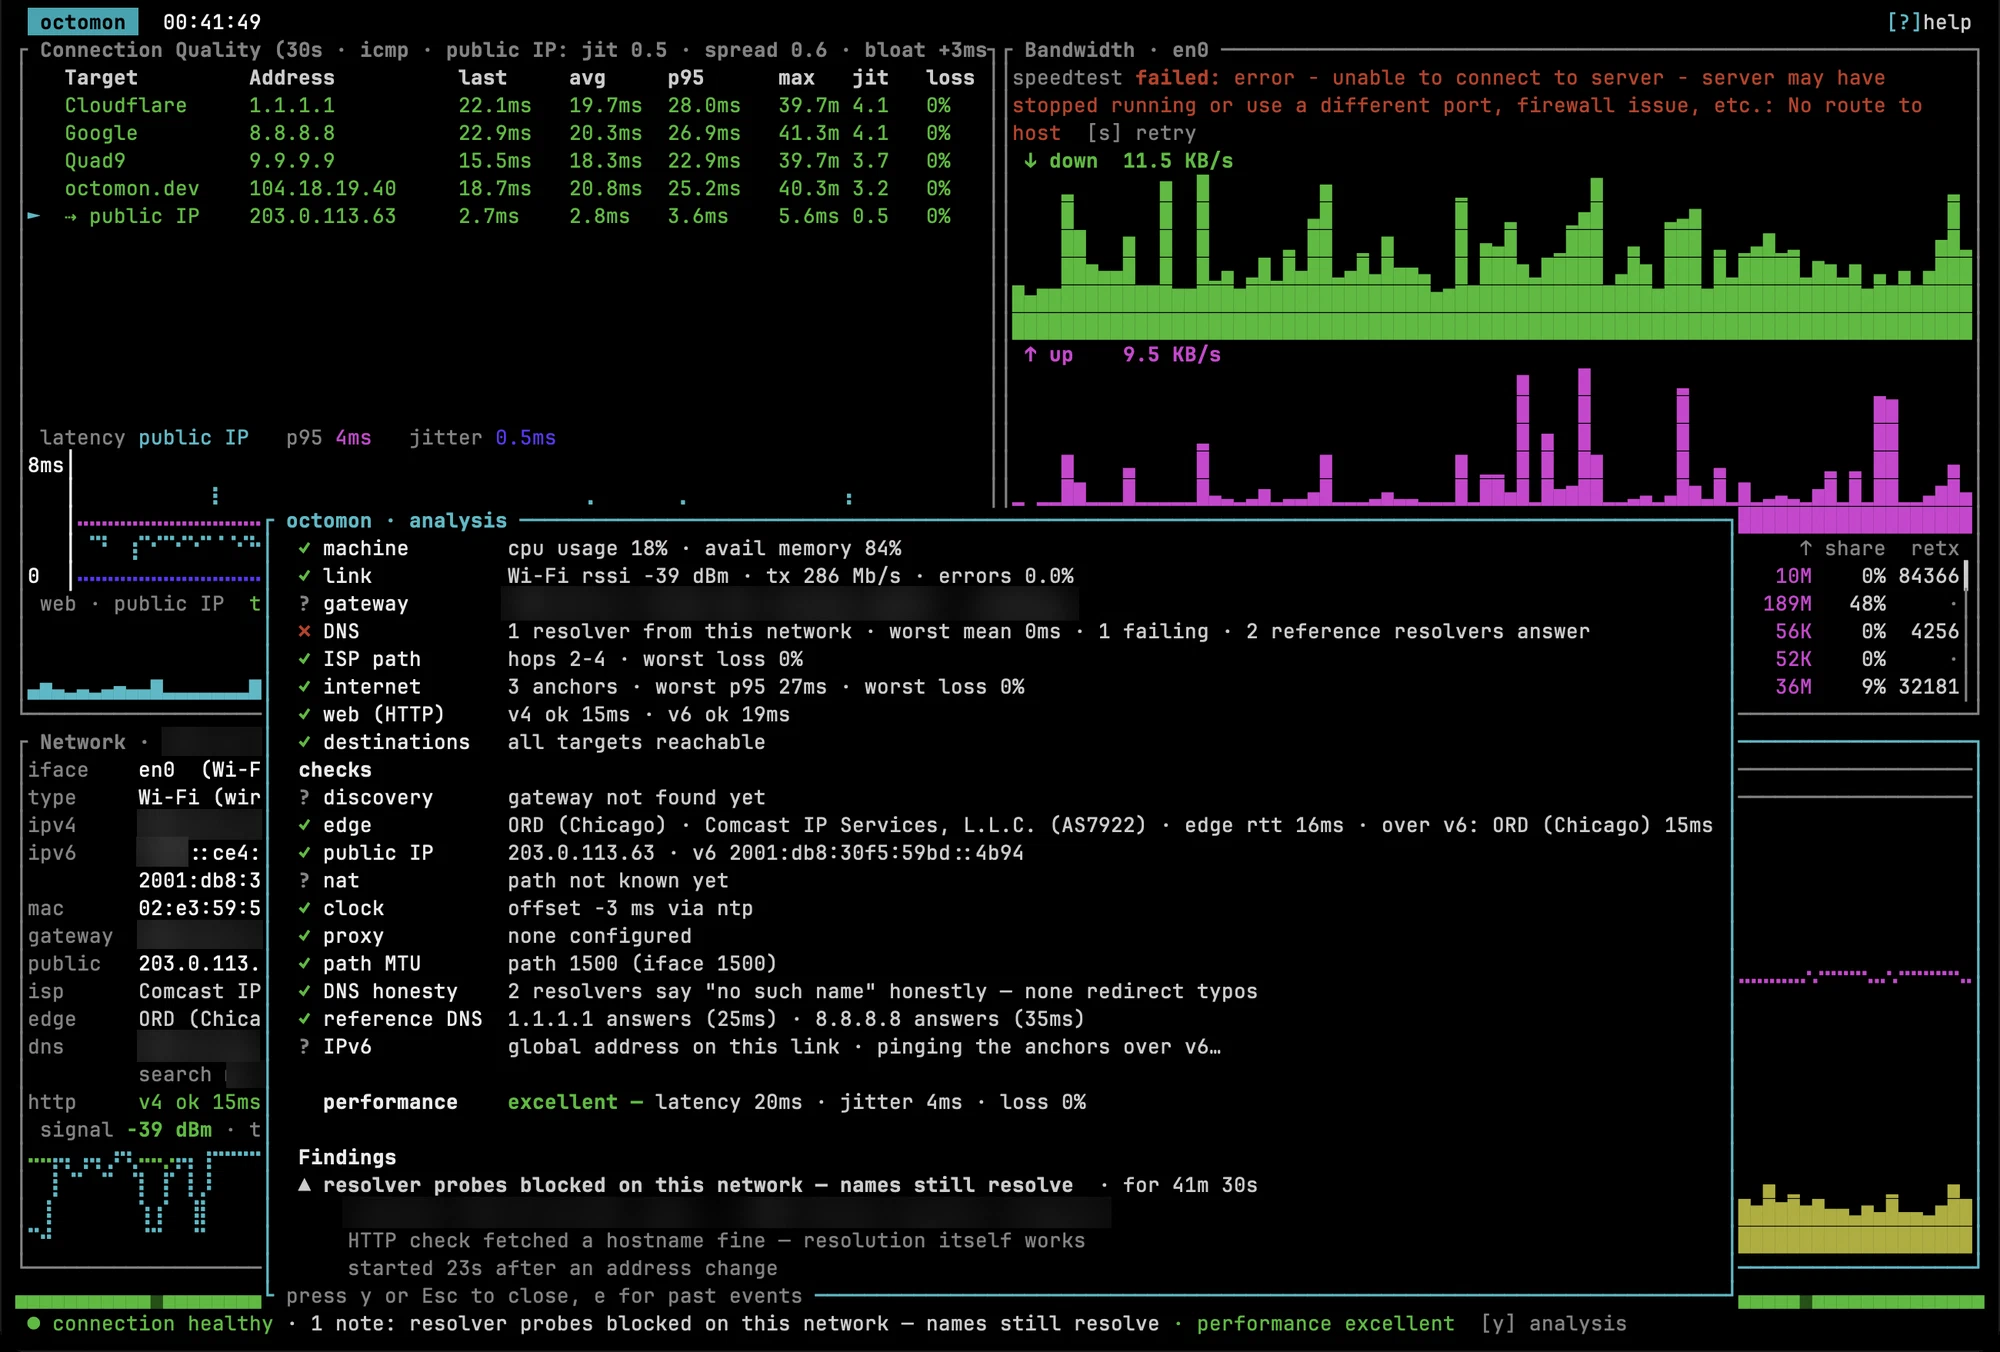
The DNS rung on the ladder was red, and the network panel showed the resolver timing out next to 1.1.1.1 and 8.8.8.8 answering fine. The evidence was all there. But the finding folded the dead resolver into the old “probes blocked” note, and the reason it gave for “names still resolve” was that its own HTTP check had fetched a hostname. That check kept passing anyway, probably on a cached name or a reused connection, so it said names resolved while nothing else on the machine could resolve one. The README says a failing resolver next to a working reference resolver means “switch DNS,” and that finding never came up.
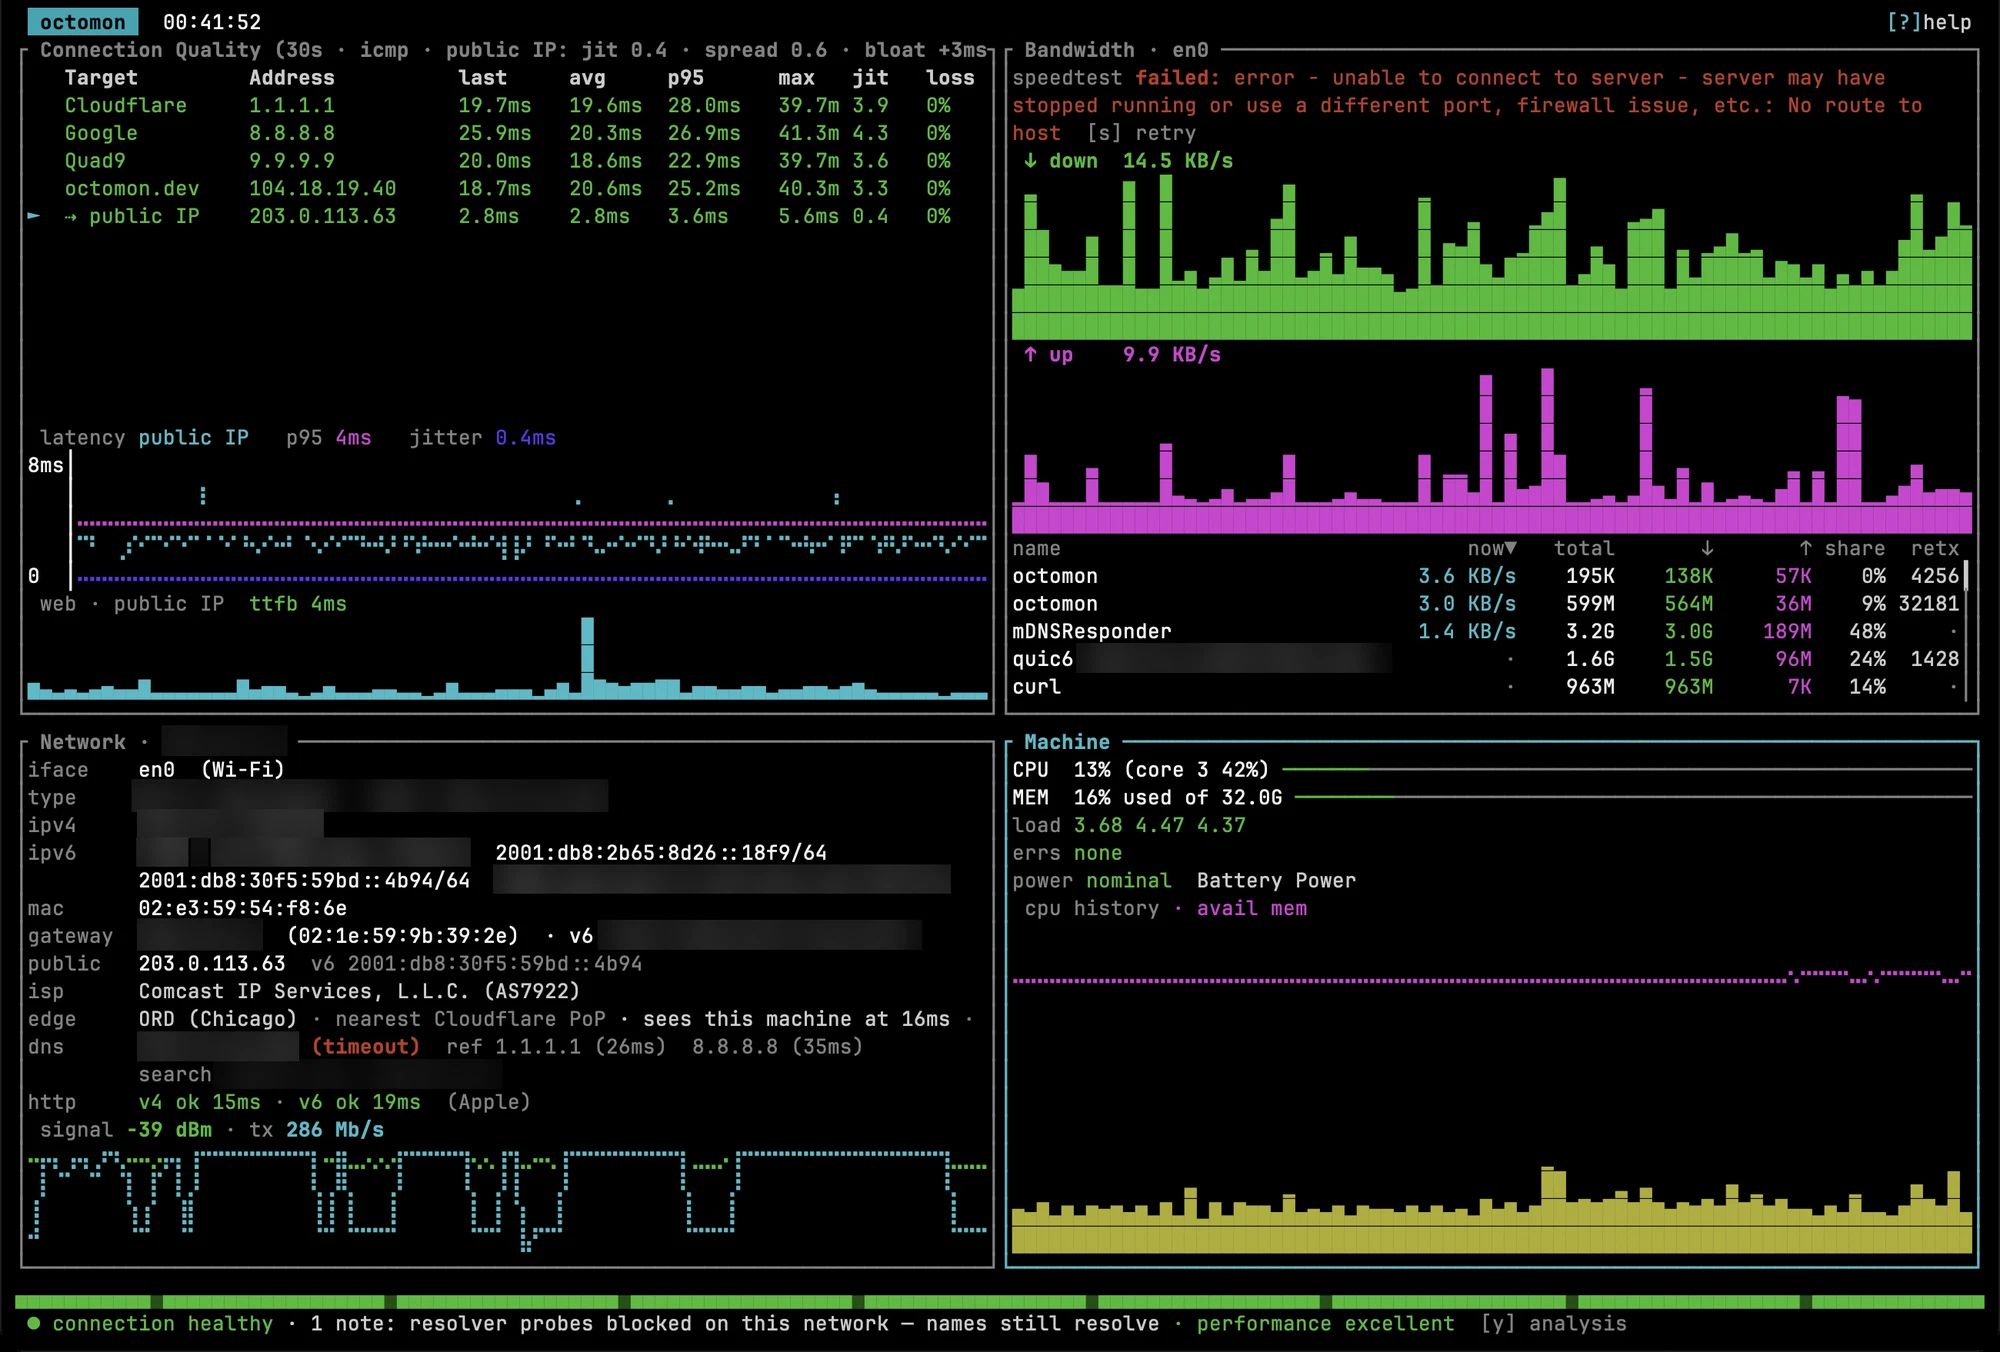
To be fair to octomon, my resolvers had already taught it that DNS probes fail here, so a resolver dying looked like more of the same. On a network whose resolvers answer example.com, it might catch this. But it told me names were resolving when none were, which is the kind of answer that sends you looking in the wrong place.
A saturated uplink
I filled the upload with macOS’s own networkQuality -d. Apple’s tool rated the result harshly…
Uplink capacity: 43.780 Mbps
Uplink Responsiveness: Low (1.258 seconds | 47 RPM)
Idle Latency: 25.598 milliseconds | 2343 RPM
octomon saw the upload in the bandwidth panel, and the anchors’ p95 latency went from the high teens to about 63 ms with spikes past 130. The verdict stayed connection healthy · performance excellent.
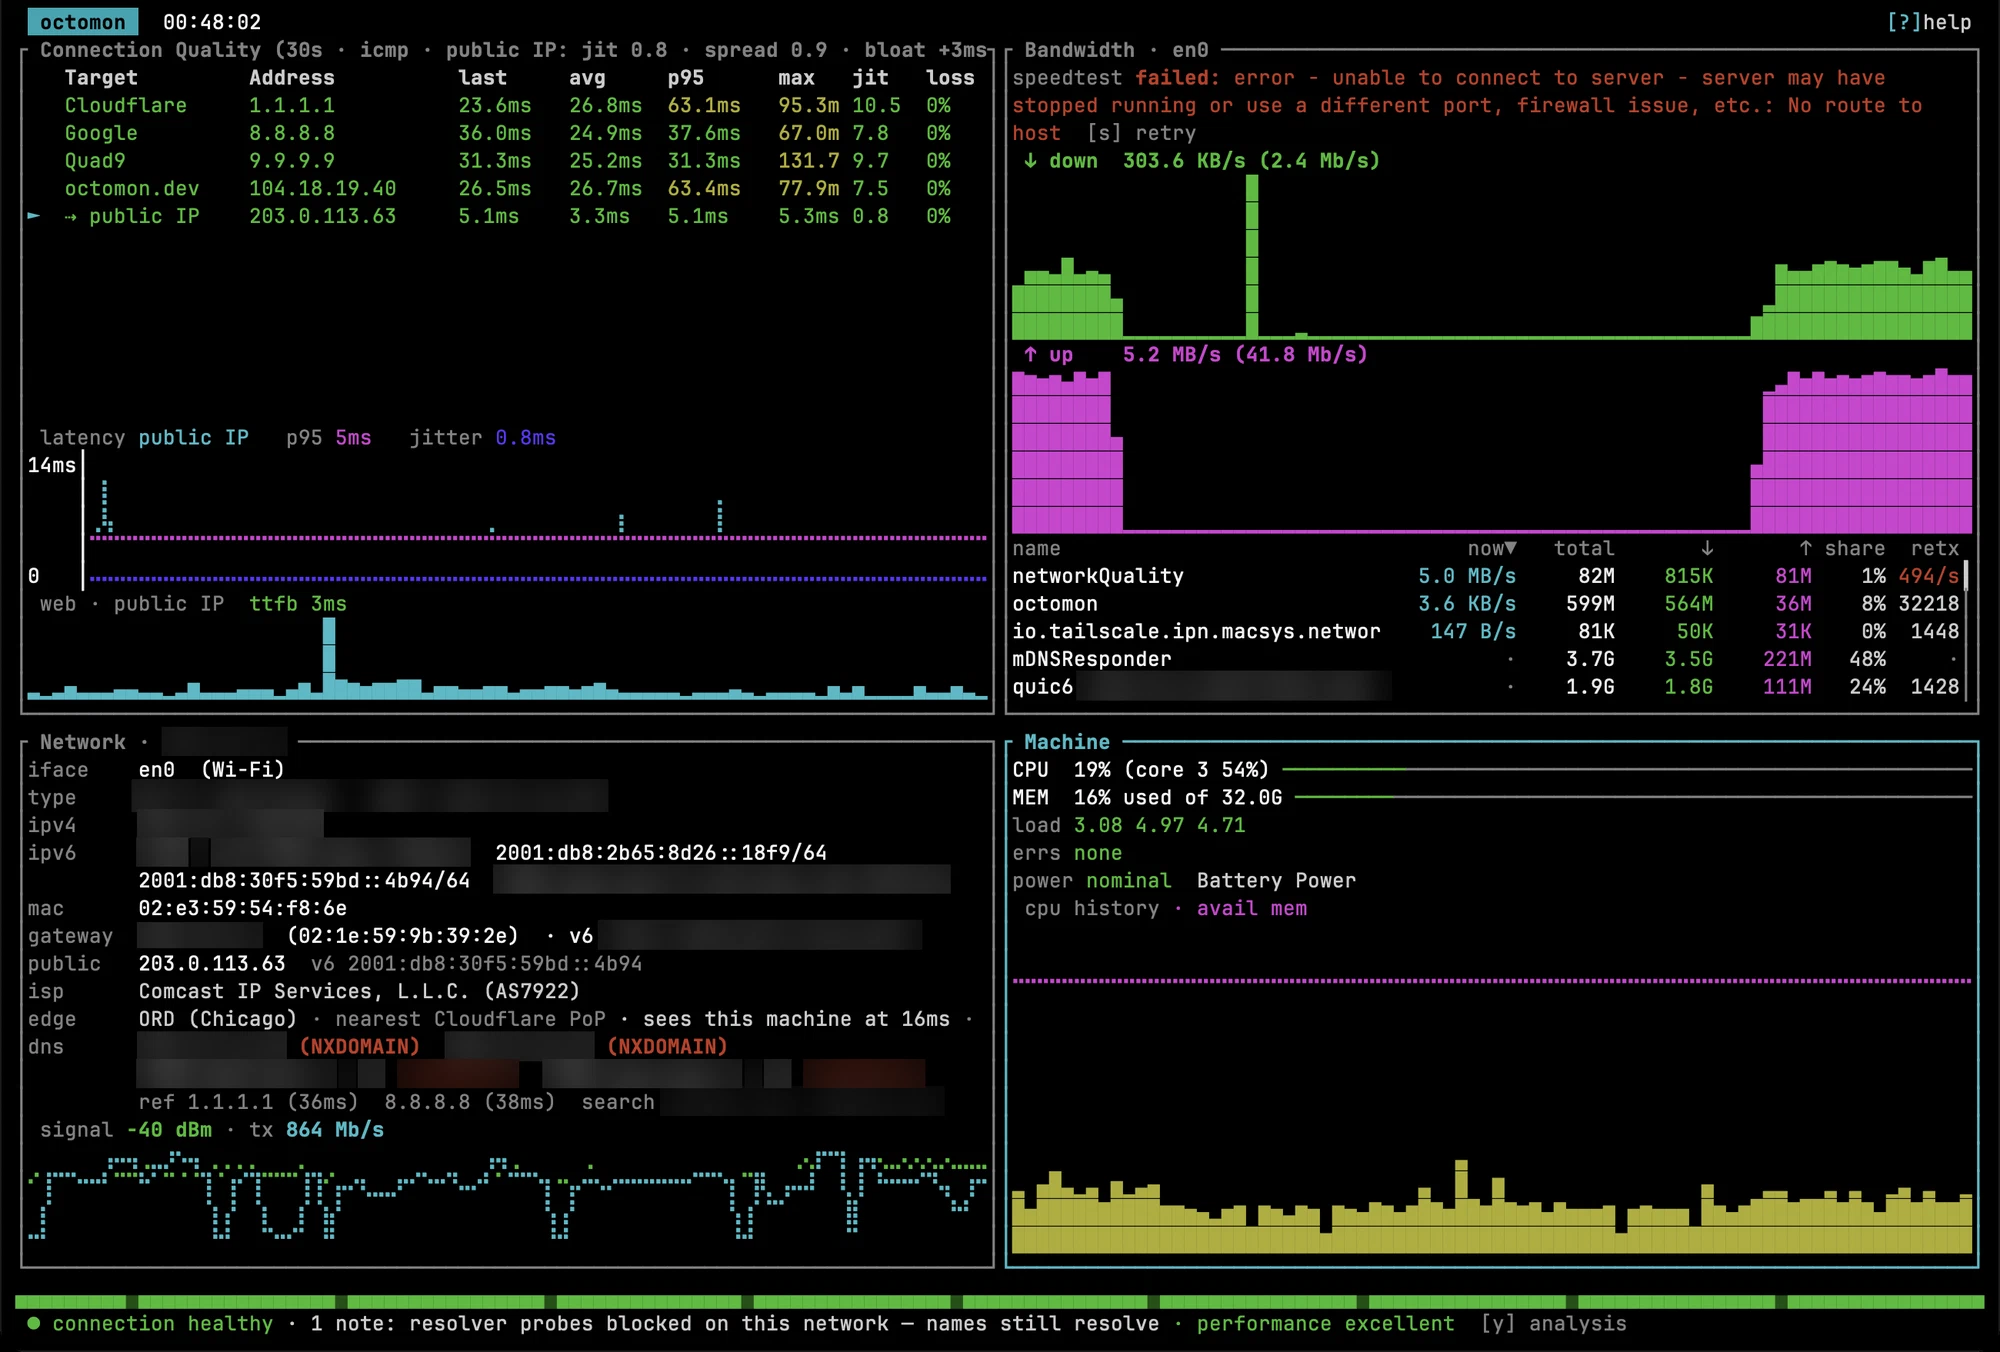
There’s a fair reason for the difference. octomon measures latency outside the flow, with pings to the anchors, while networkQuality measures inside the loaded connections, including the Mac’s own send buffers. A router doing proper queue management keeps other flows fast even when one flow is bloated, and from outside the flow that looks fine. Its speed test did grade the same connection’s bloat as moderate earlier. Watching passively, though, it won’t tell you your upload is bloated.
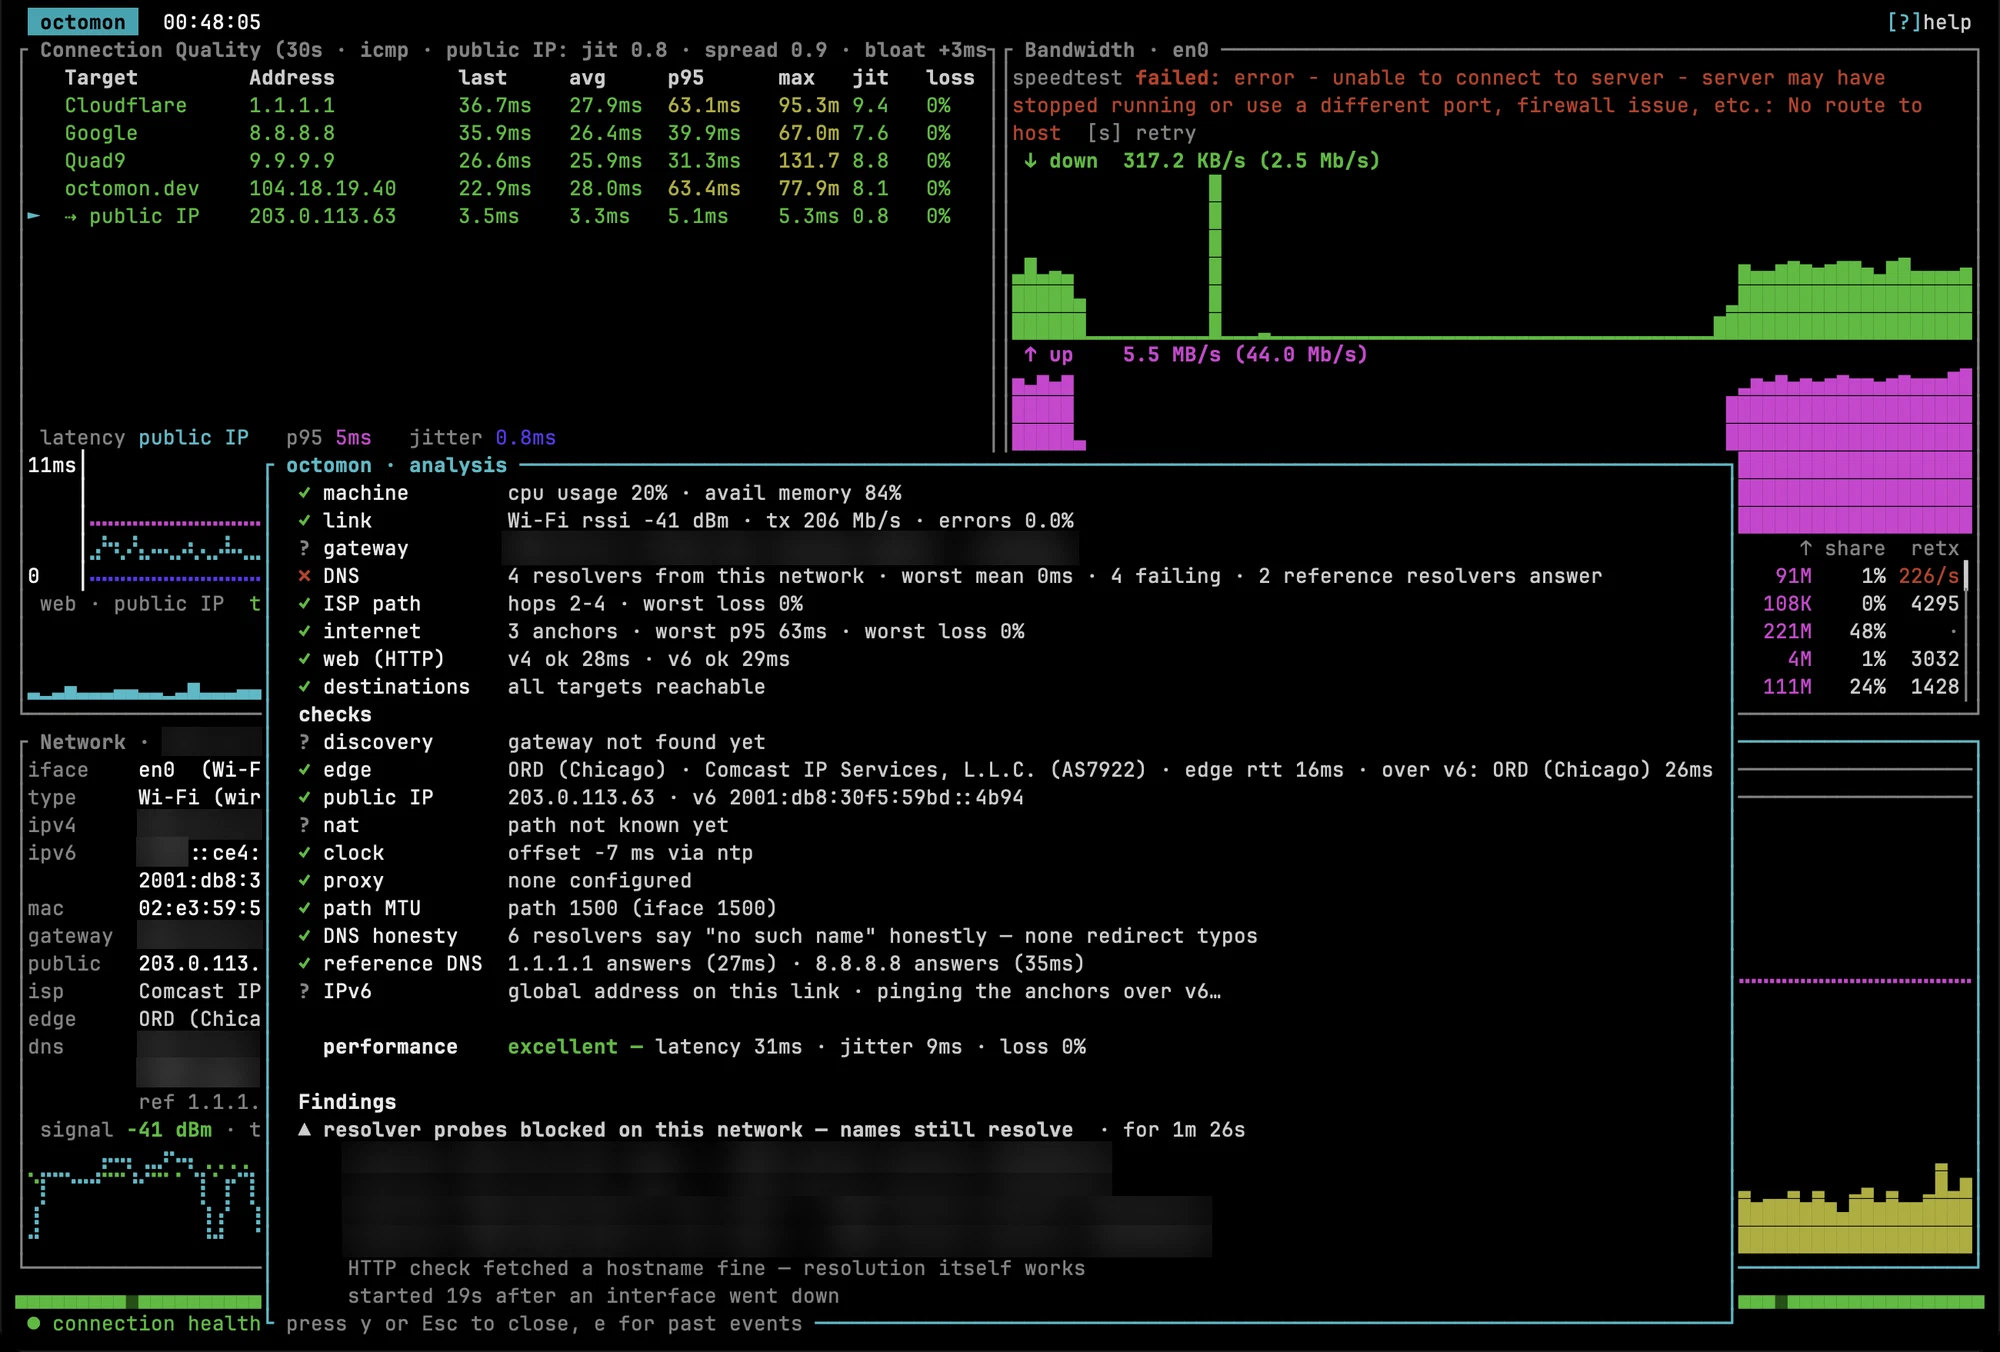
A second run with hop discovery on went worse. octomon raised Google degraded (15% loss) — your connection is fine, then internet degraded beyond the gateway (2 of 3 anchors failing), and tied both to Tailscale going down a minute earlier. The cause was the Mac filling its own 43 Mb/s uplink, which is my side of the ISP link. The ISP path rung stayed green the whole time. The README promises correlation stated as correlation, and that’s what I got, but it correlated the wrong event and named the wrong layer.
Walking away from the access point
I carried the MacBook from the access point out of the house, because coverage stays pretty decent everywhere inside it. I bet my neighbors wondered why I was standing in the middle of the front yard around 11 PM holding a laptop. Signal went from about -46 dBm to -82, the transmit rate fell to 16 Mb/s, and octomon’s numbers tracked system_profiler within a few dB the whole way.
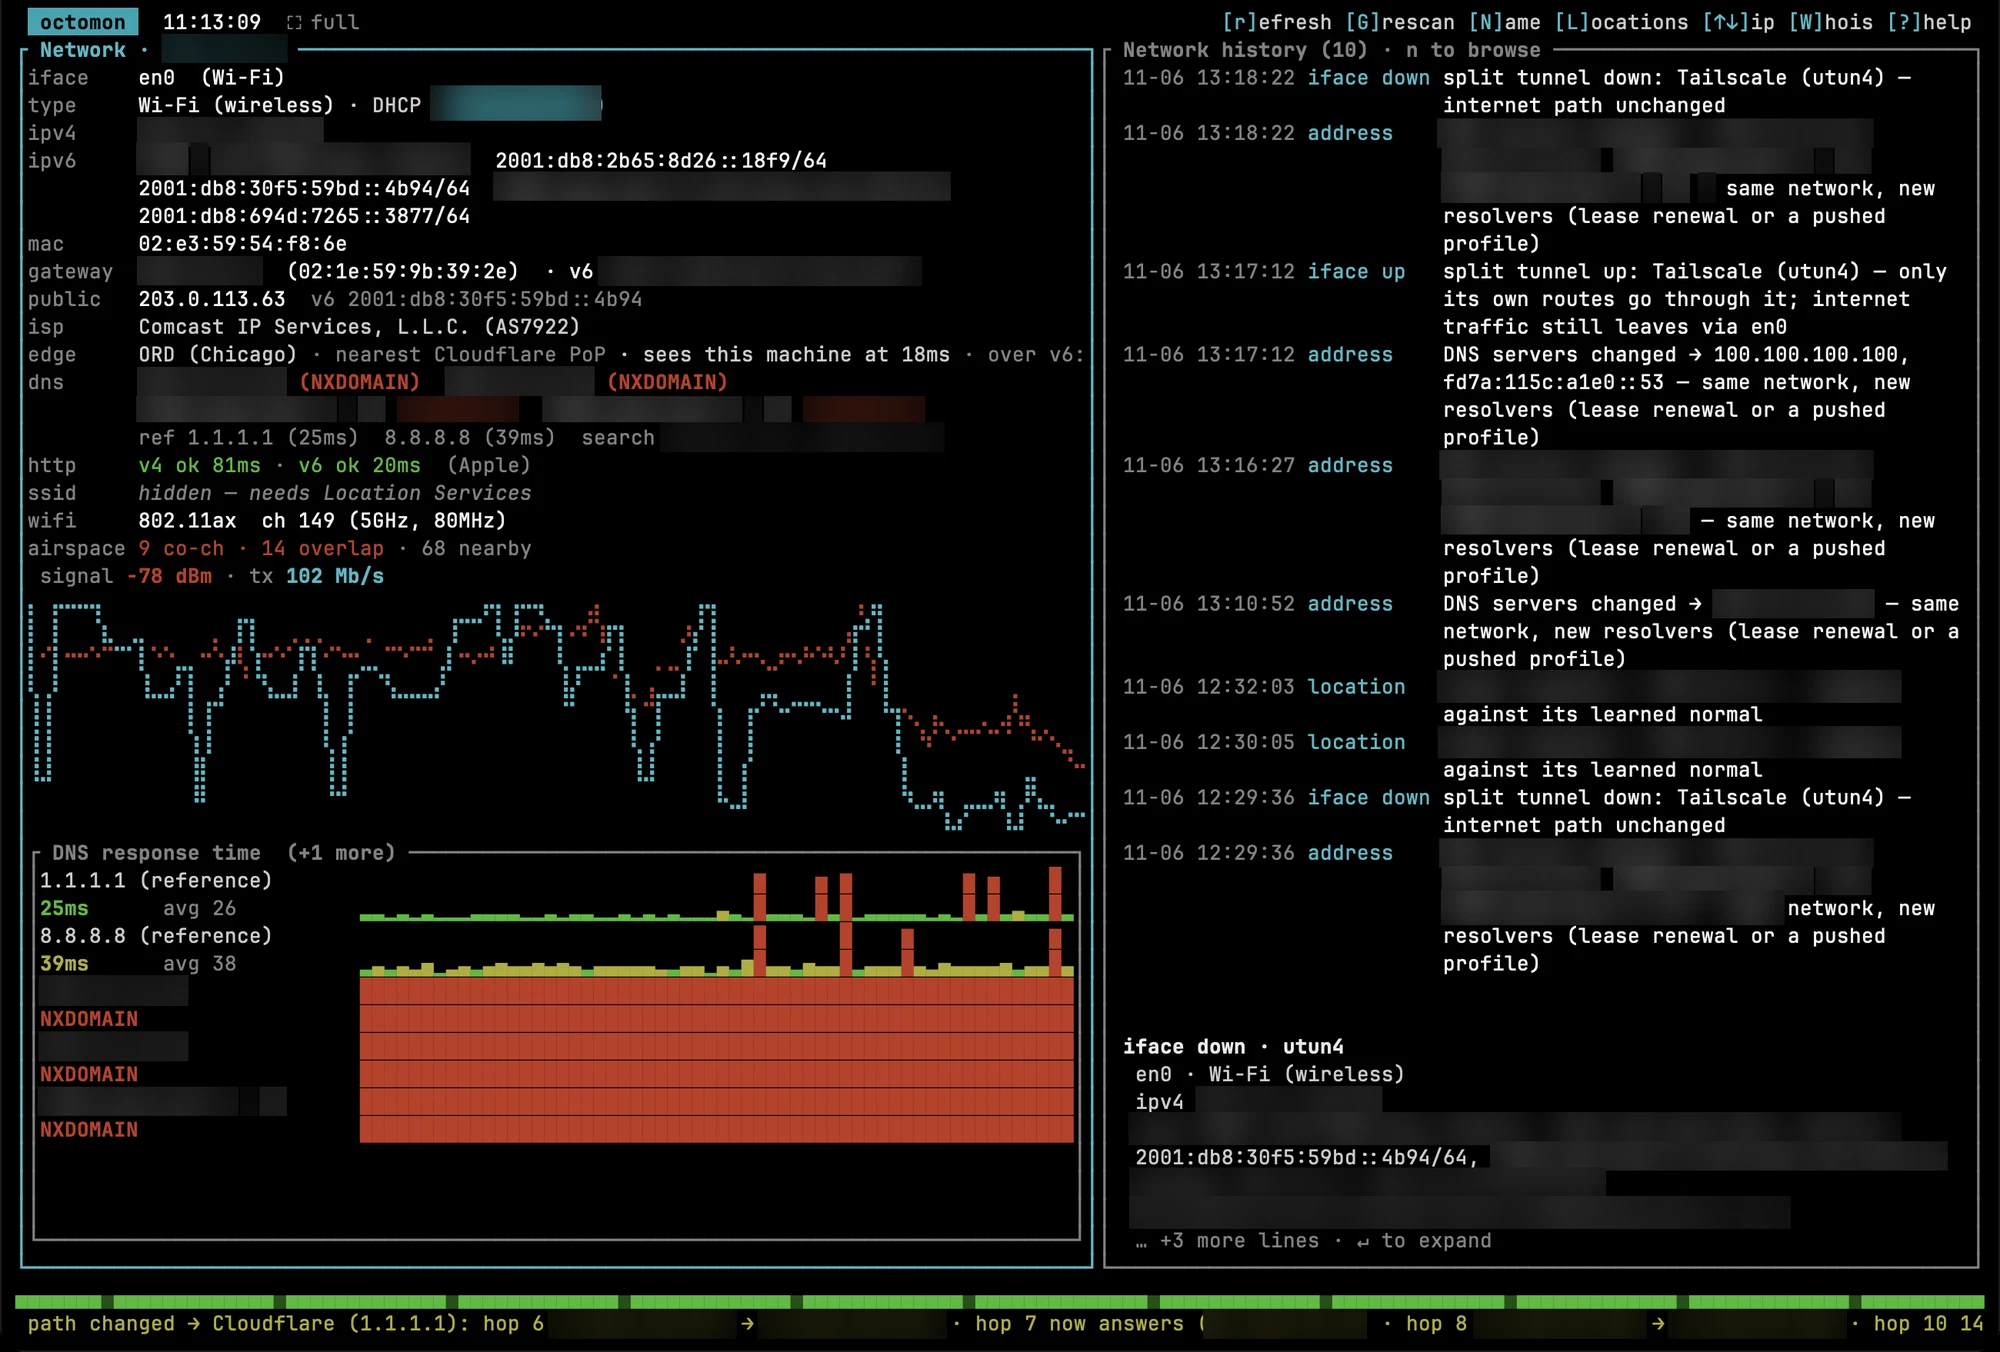
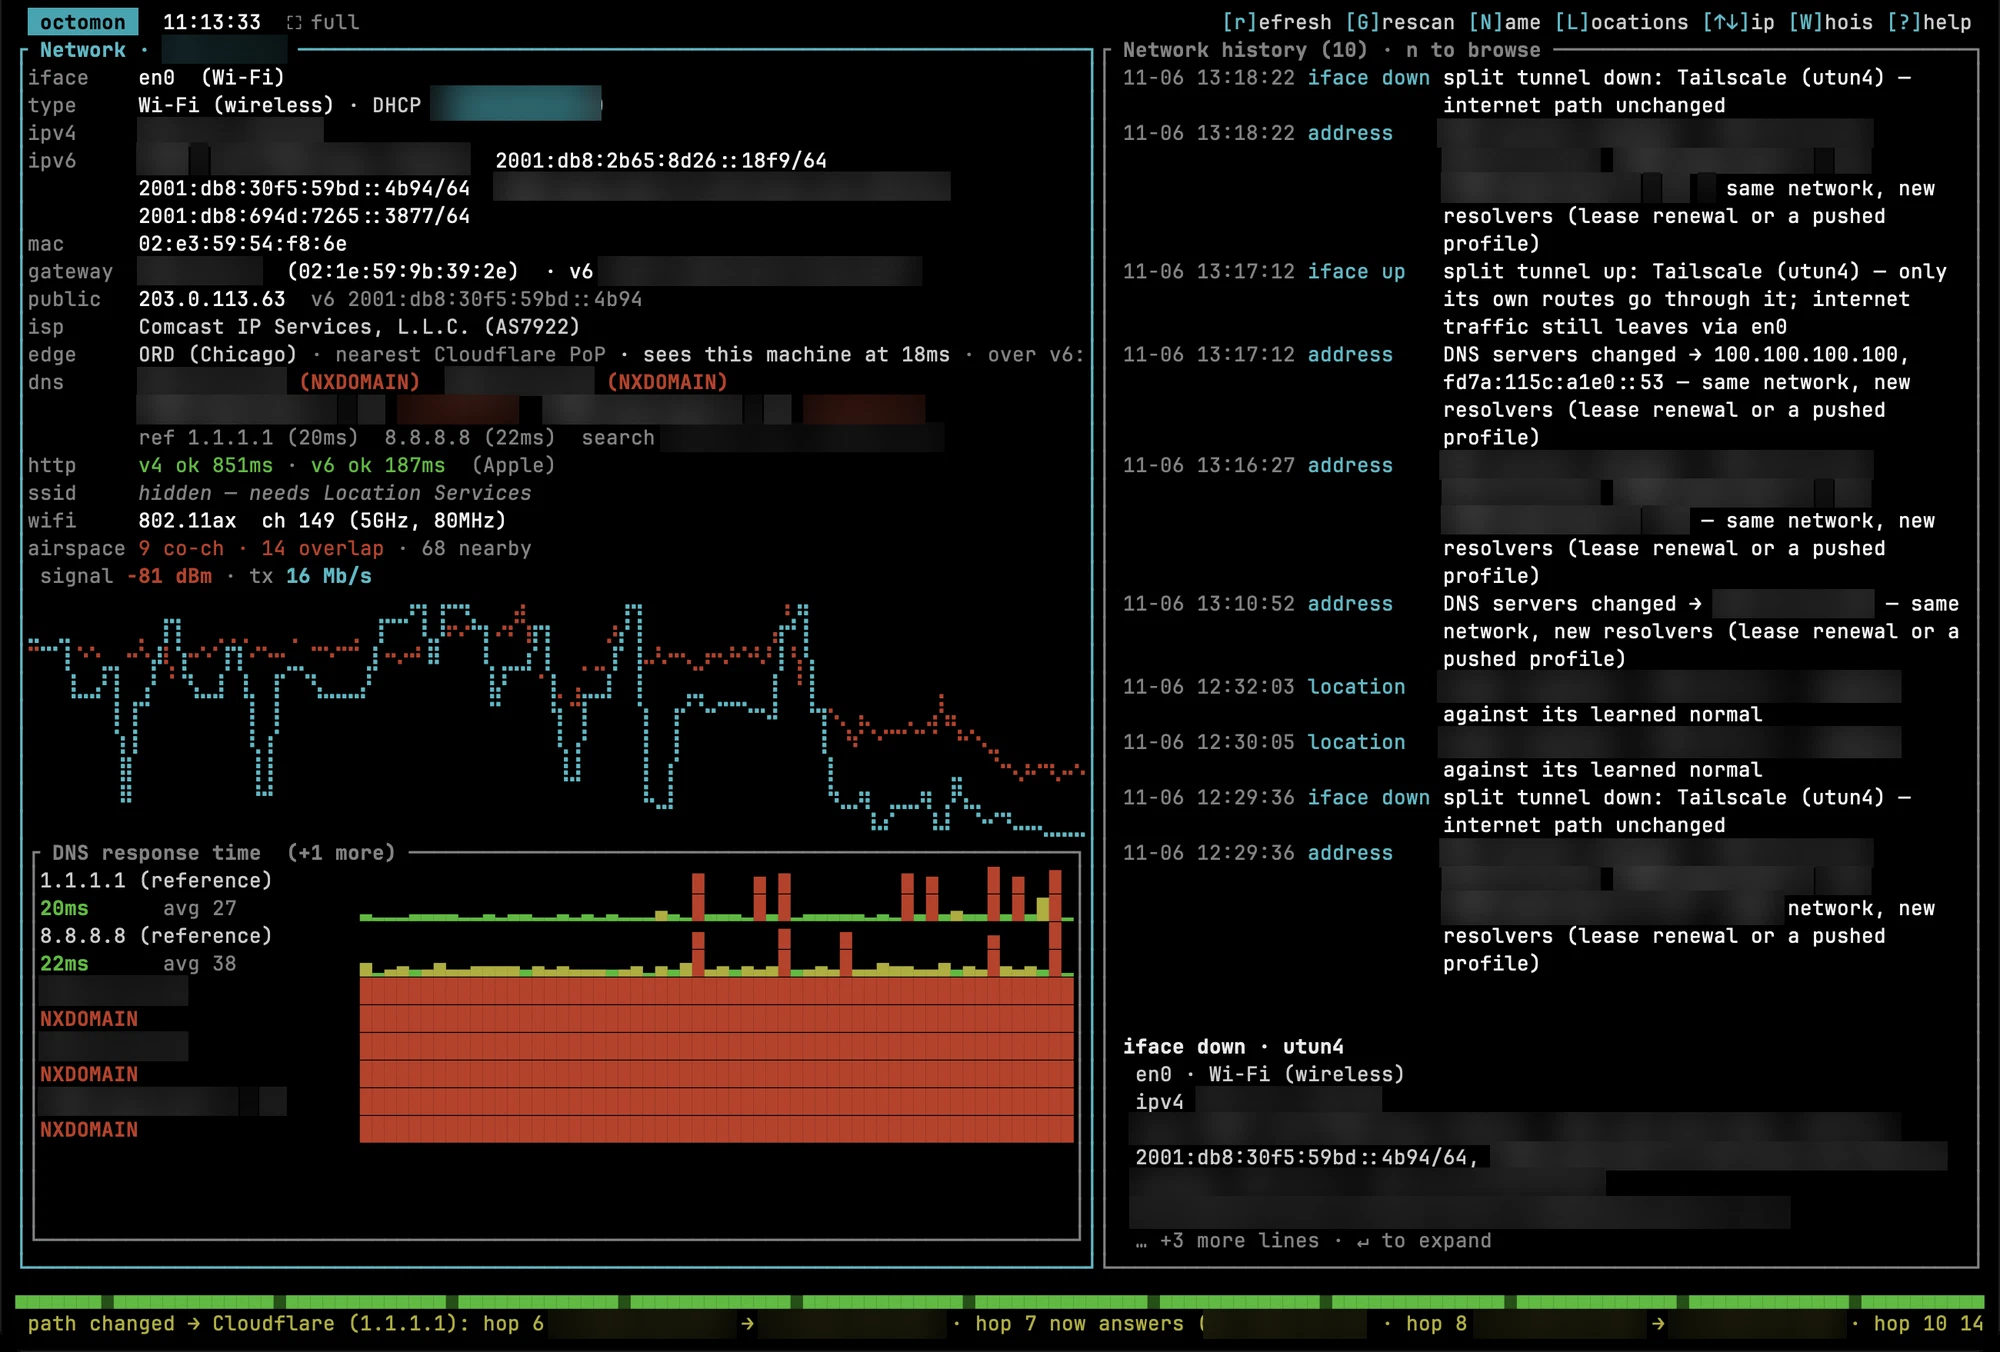
octomon did notice. The events timeline logged ▲ Wi-Fi signal weak (rssi -75 dBm) — not yet hurting, and later logged its end. You’d only find it there, though. The verdict line read connection healthy · performance good while p95 latency to the anchors climbed past 120 ms, and the status line spent the entire walk scrolling path change notices instead.
On the way the Mac moved from channel 149 to 153 and back. octomon picked up the new channel about 20 seconds after macOS did, logged no roam, and never produced the “3s after a Wi-Fi roam” correlation the README uses as its example, even though latency jumped at the same moment.
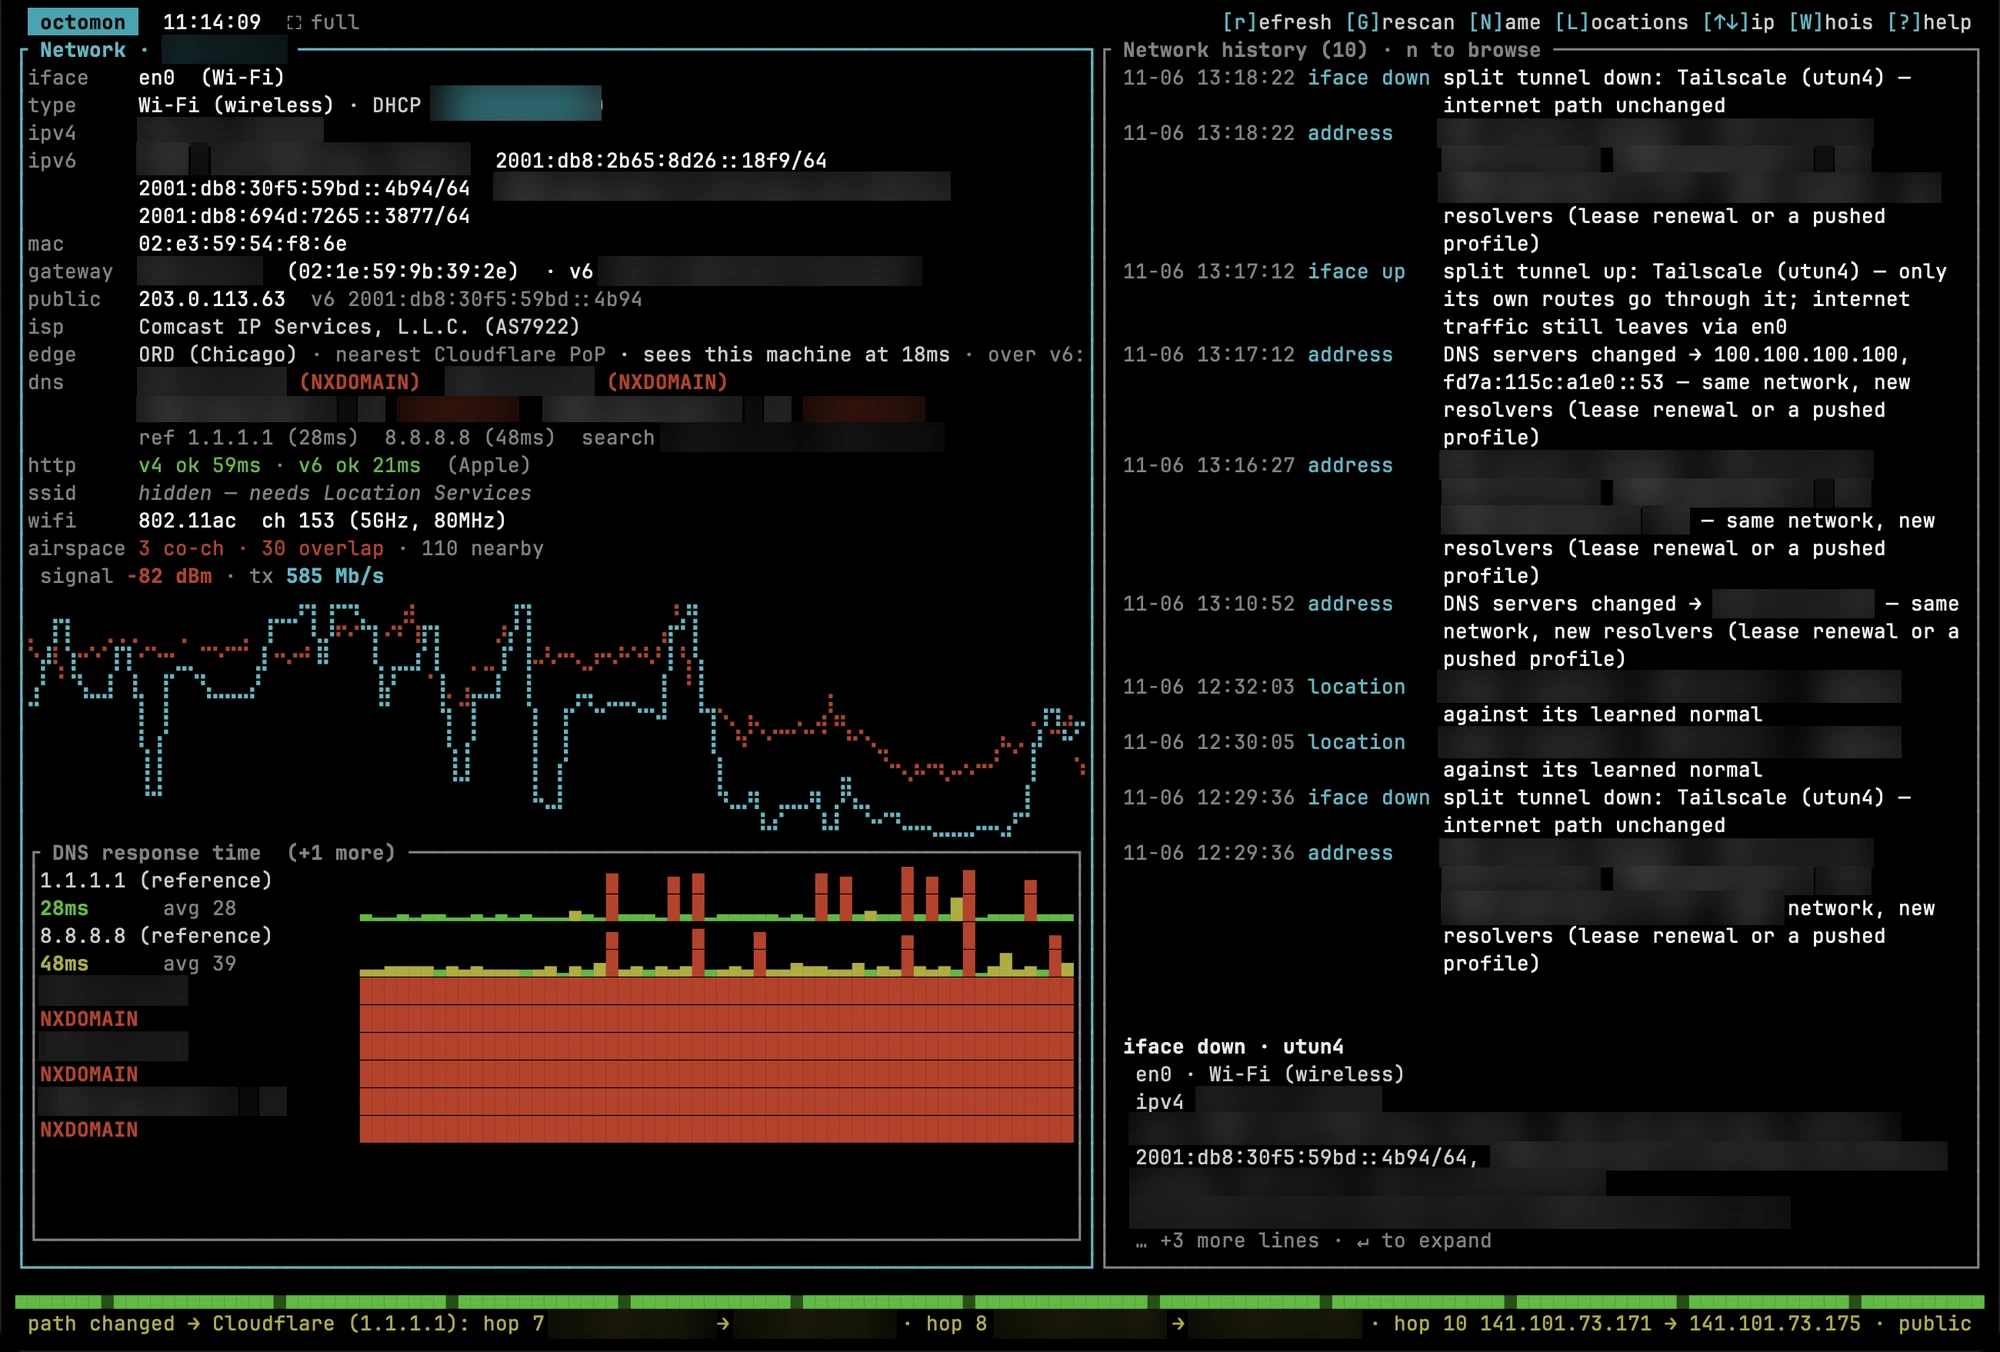
Without Location Services octomon can’t see the BSSID either, which may be why it can’t tell a roam from a channel change. The README doesn’t say. If you care about roaming, grant your terminal Location Services before you test it.
Wi-Fi off
I turned the Mac’s Wi-Fi off for a minute. octomon raised not connected — Wi-Fi is off or not associated four seconds after the link dropped.
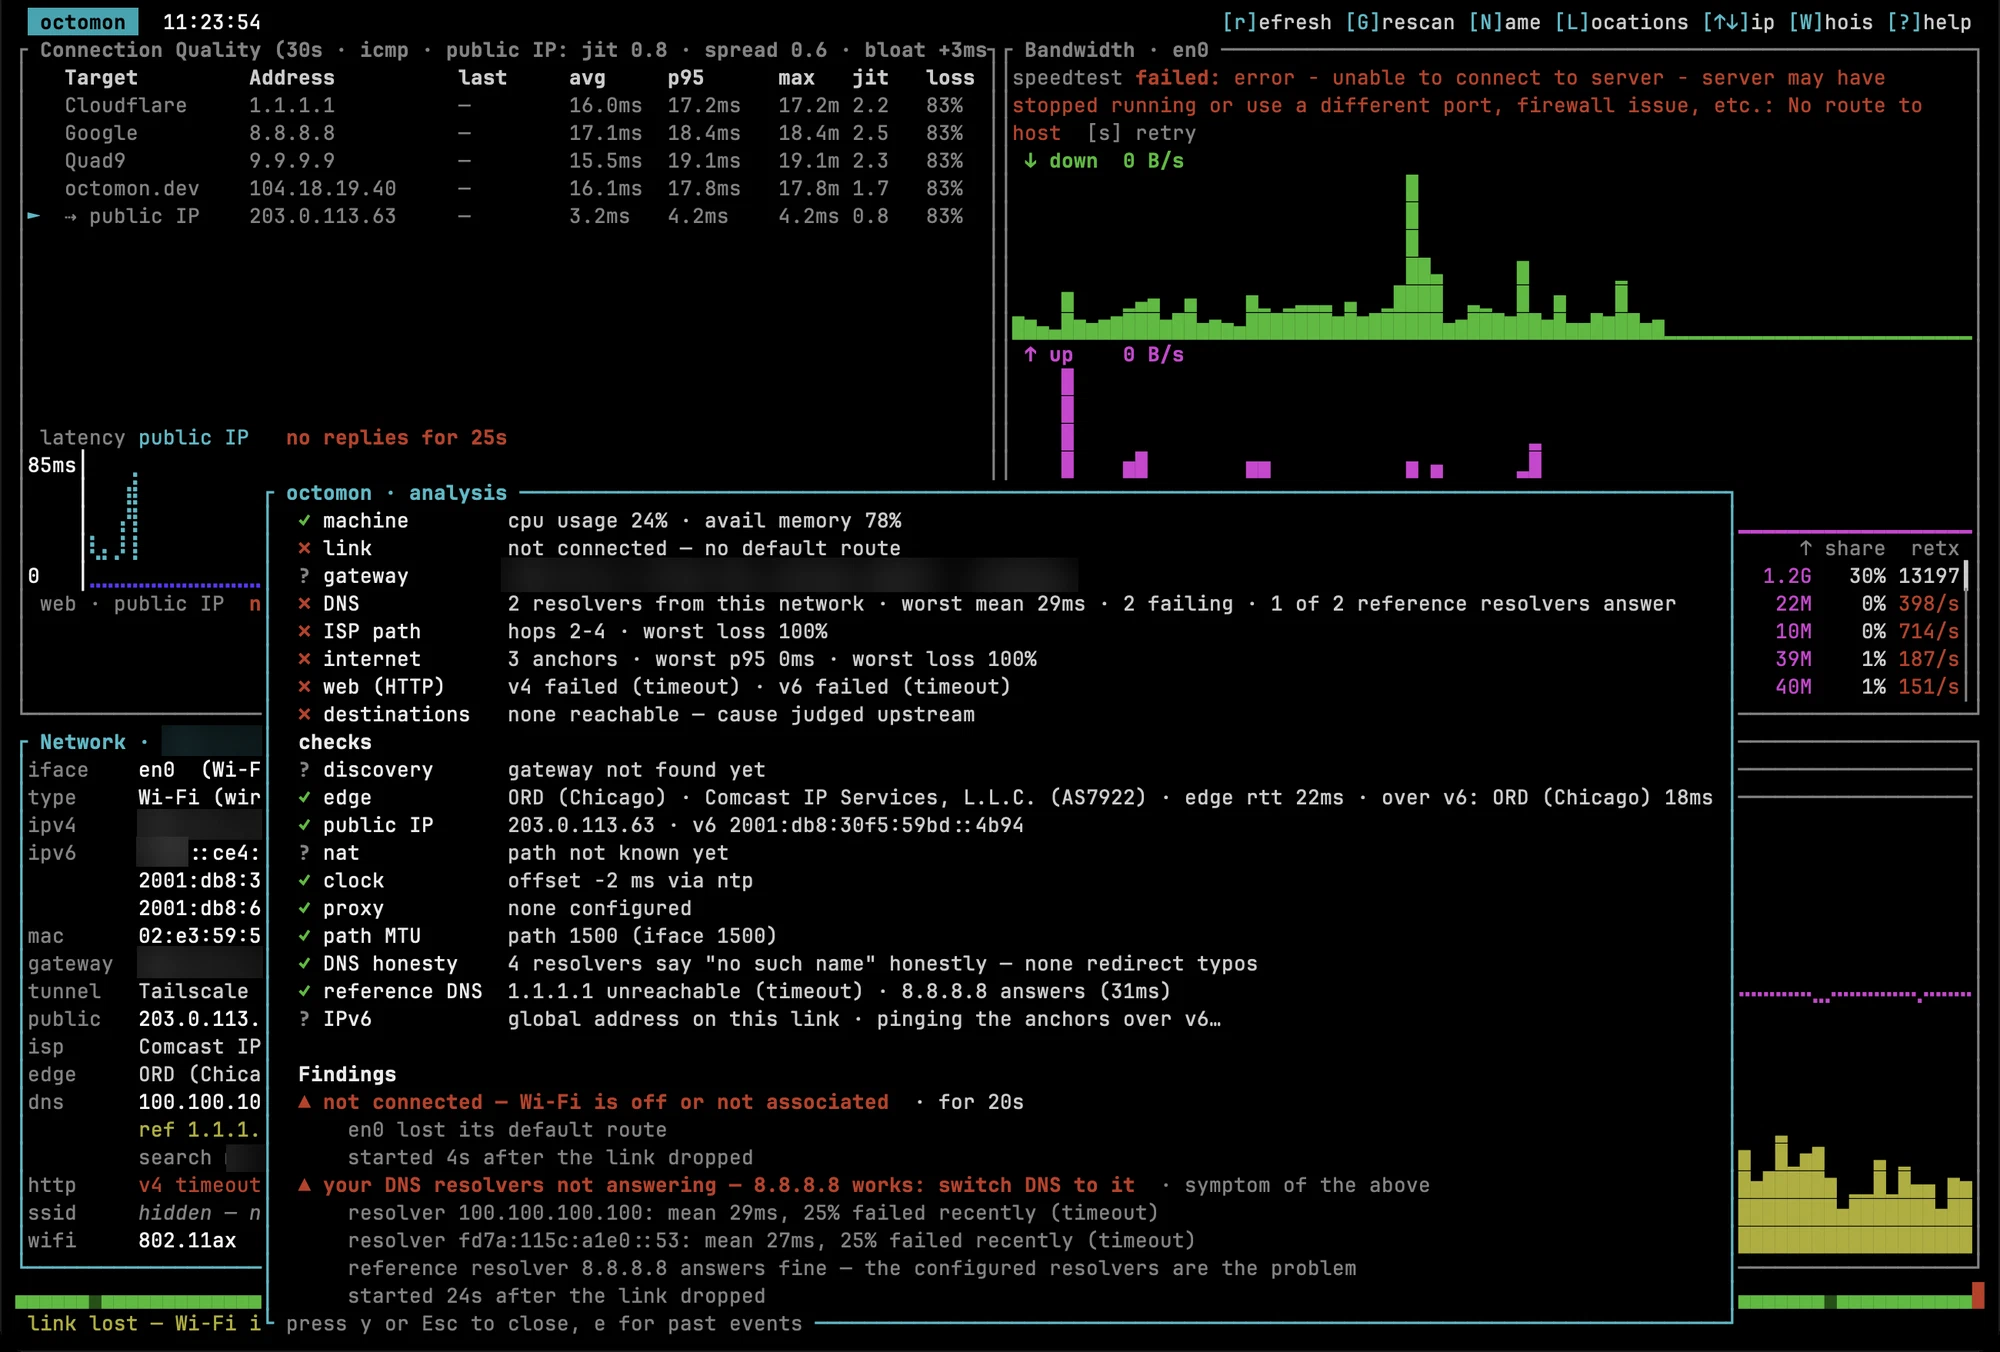
Twenty seconds later it also raised your DNS resolvers not answering — 8.8.8.8 works: switch DNS to it. With no link, 8.8.8.8 doesn’t work either. The ladder ranks it as a symptom of the link being down, but the --watch output prints it as a finding of its own, and it’s the “switch DNS” advice that never appeared during the actual DNS failure.
The outbound port check
c tests a list of common outbound ports over IPv4 and IPv6, with a column explaining why each one matters. It took 10 to 15 seconds. Only SMTP on port 25 came back filtered, which it correctly labels as normal for a home ISP.
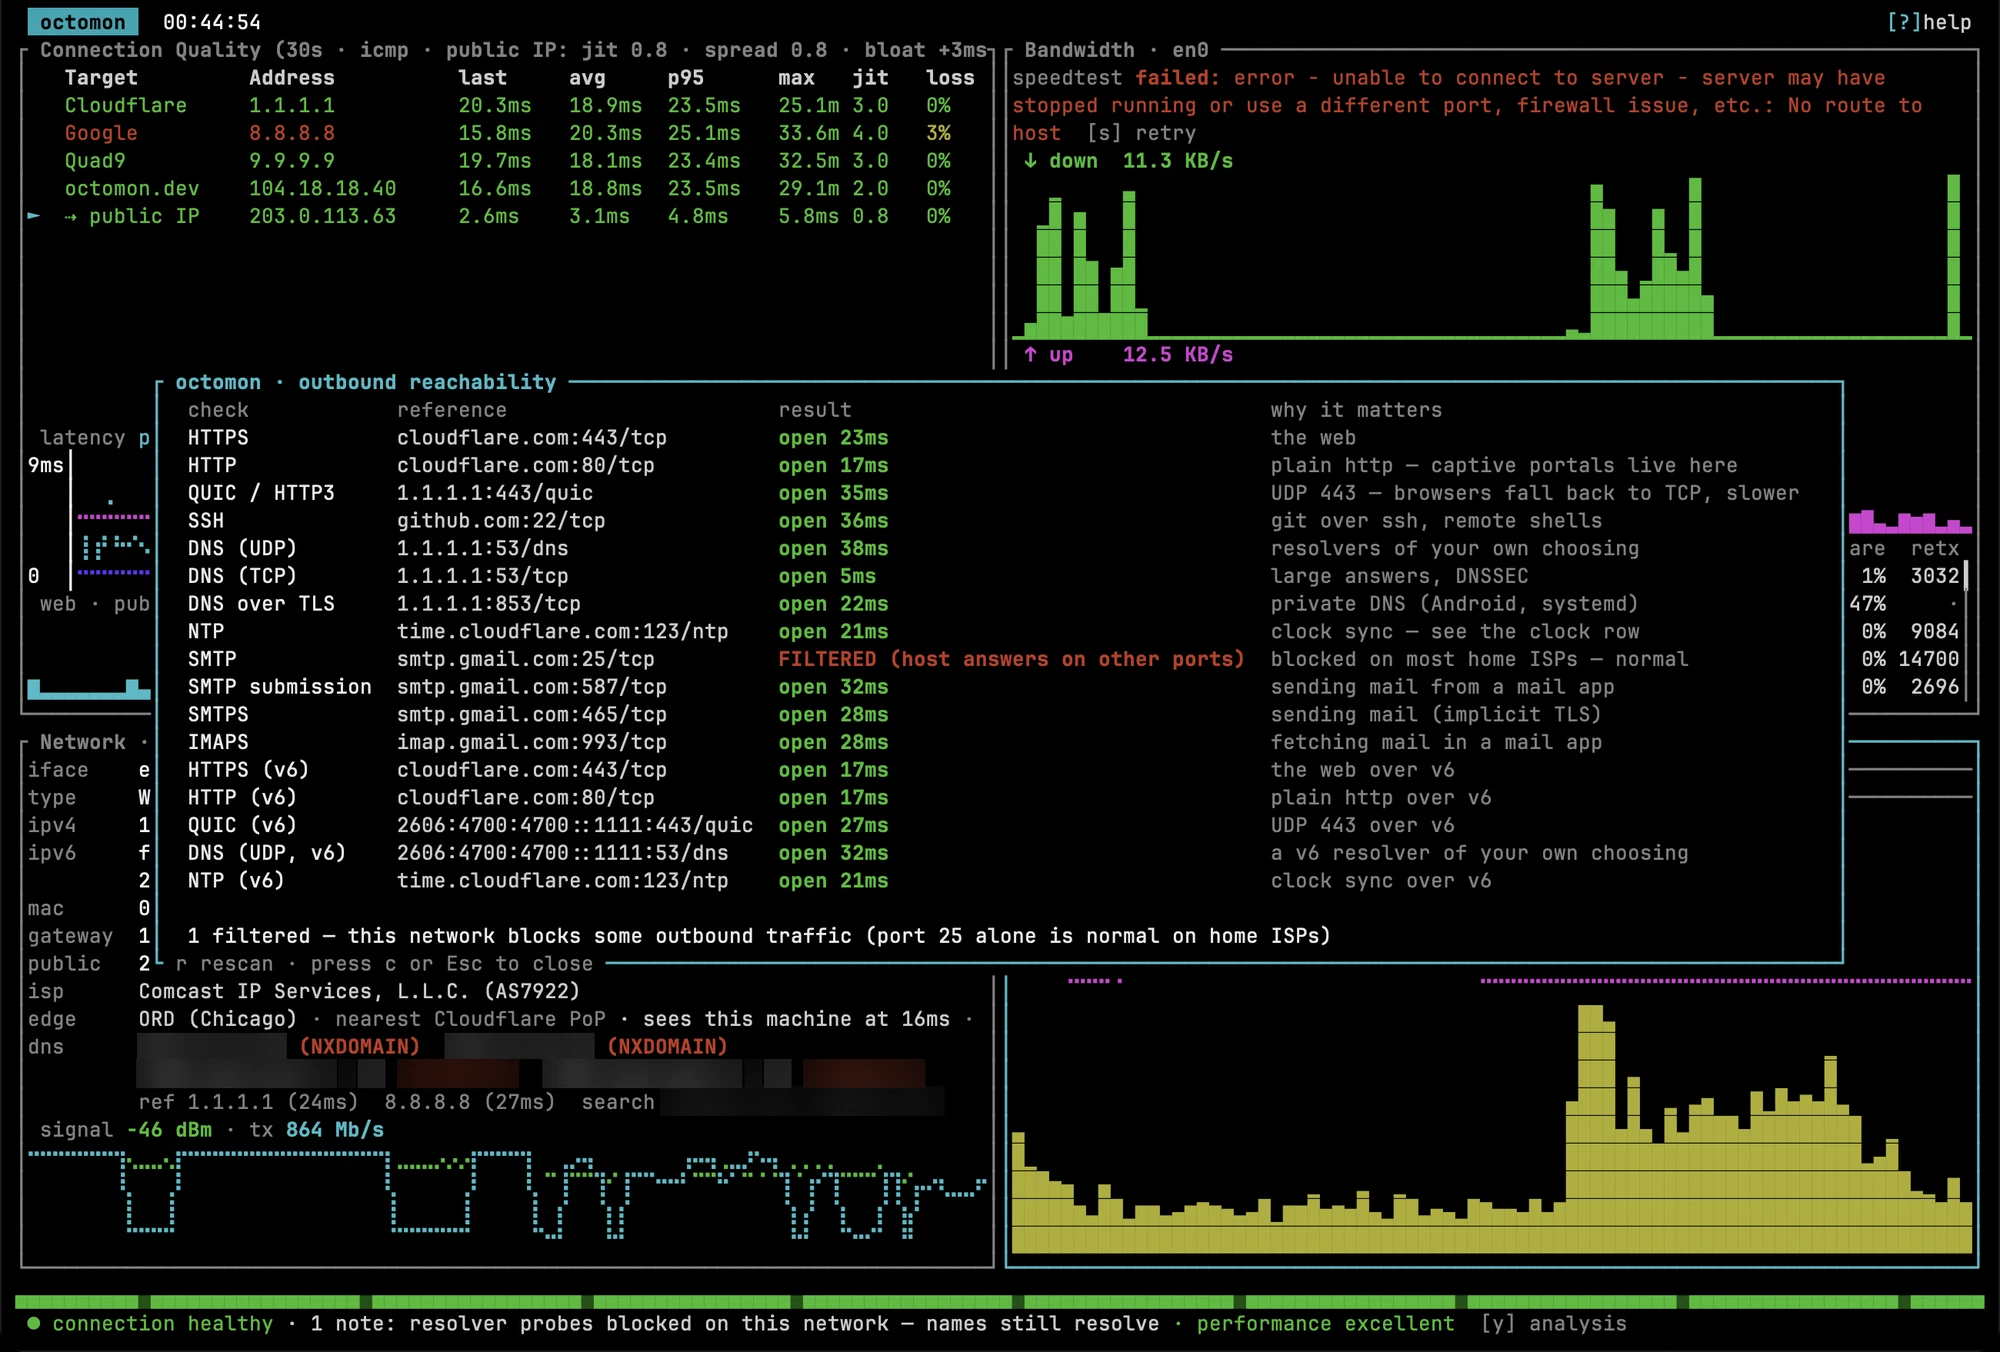
The session bar and the events timeline
The bar under the panels colors each slice of the session green, yellow or red. b walks it, [ and ] jump between changes, and z zooms in. After a night of breakage, it’s a decent picture of what happened when.
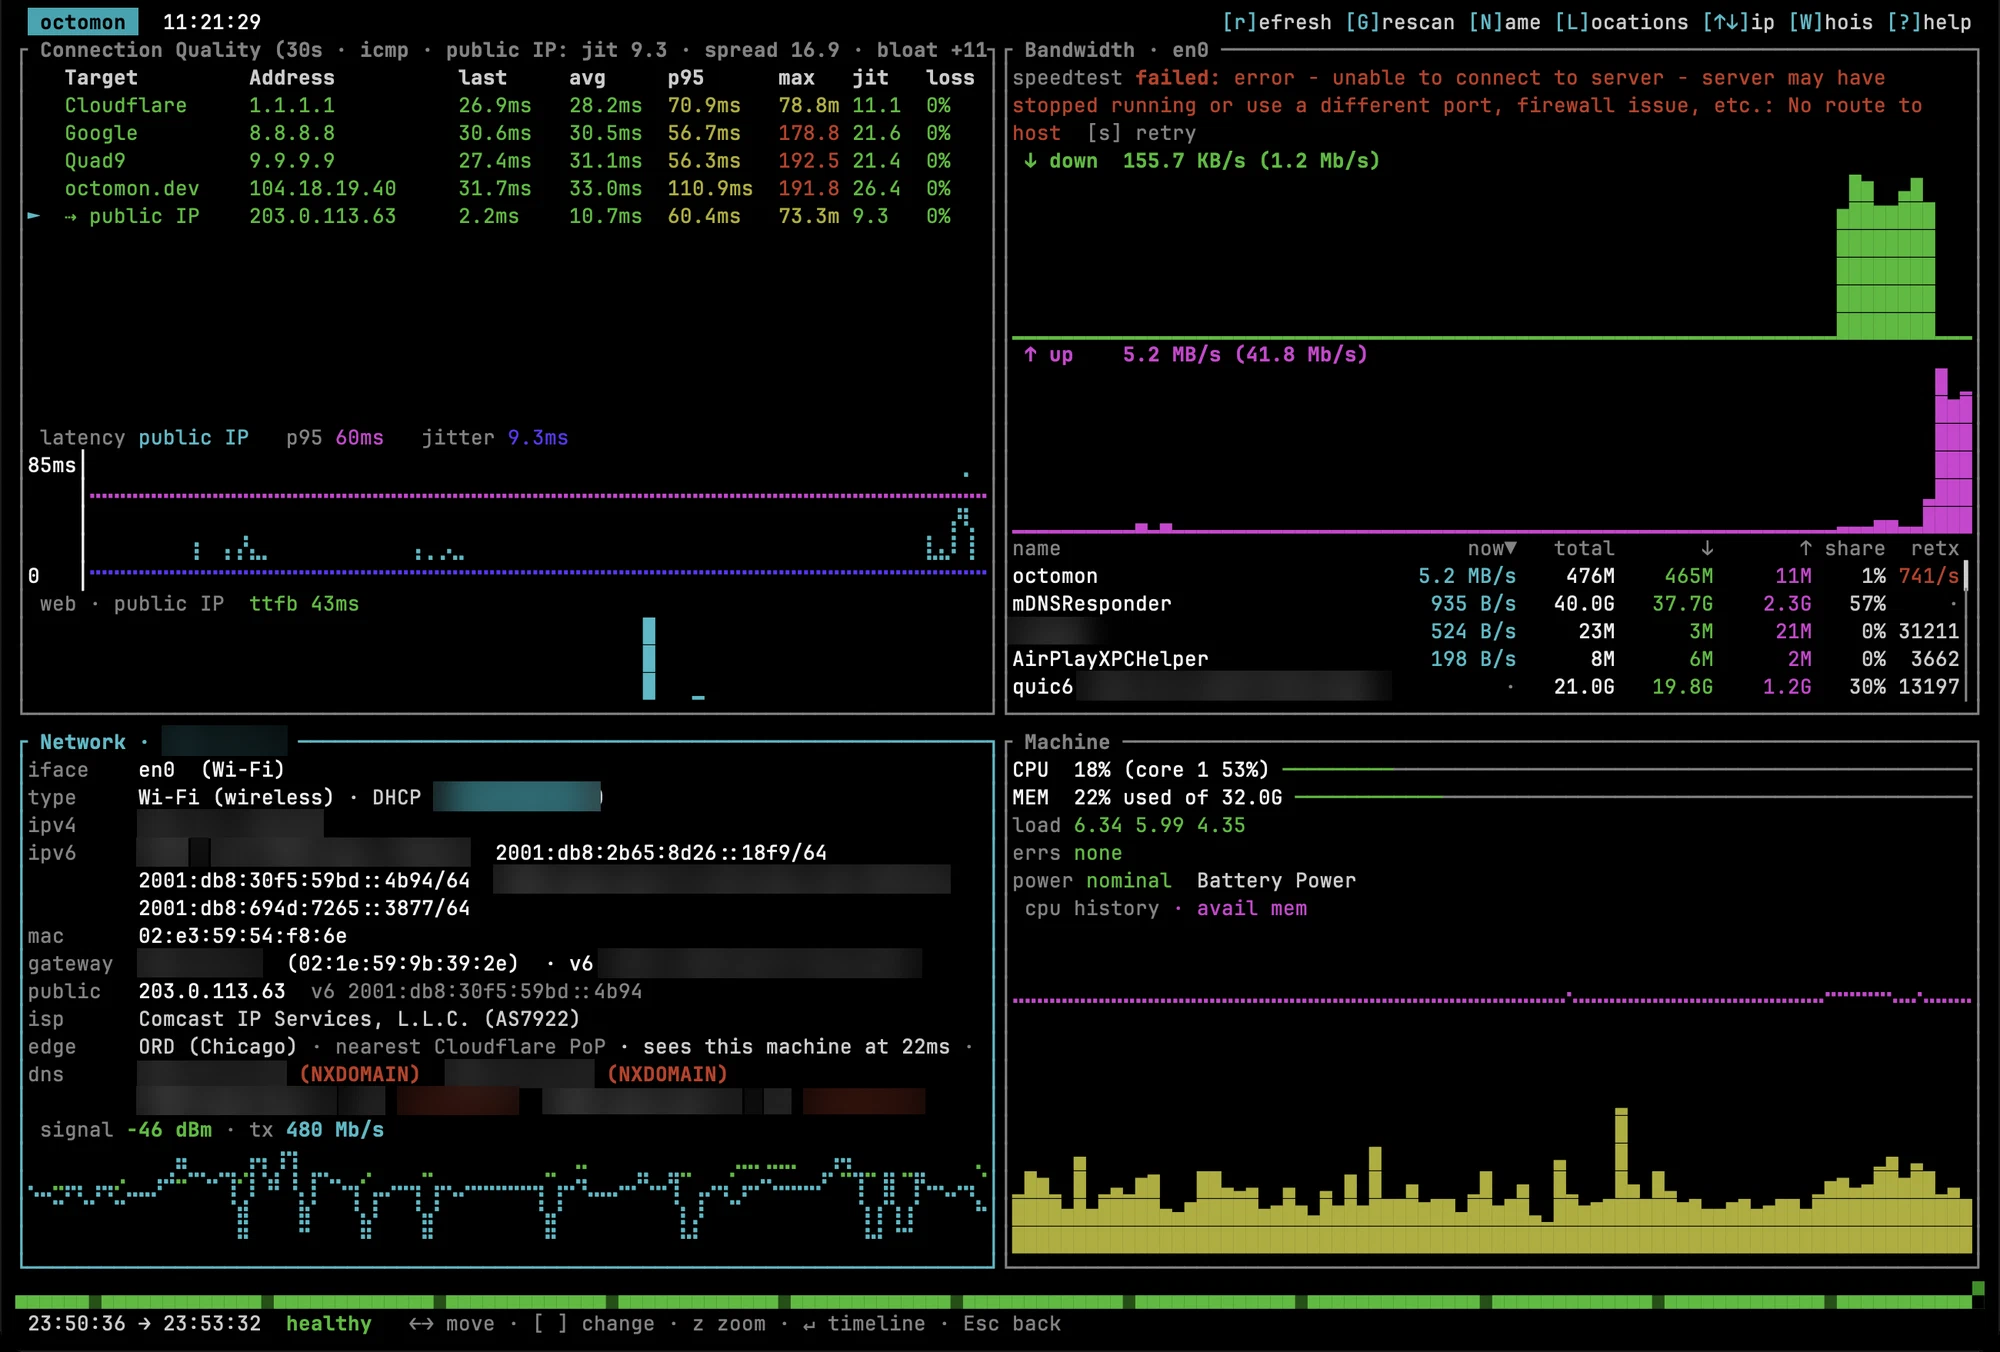
e opens the events timeline, the history of joins, address and resolver changes, path changes and findings.
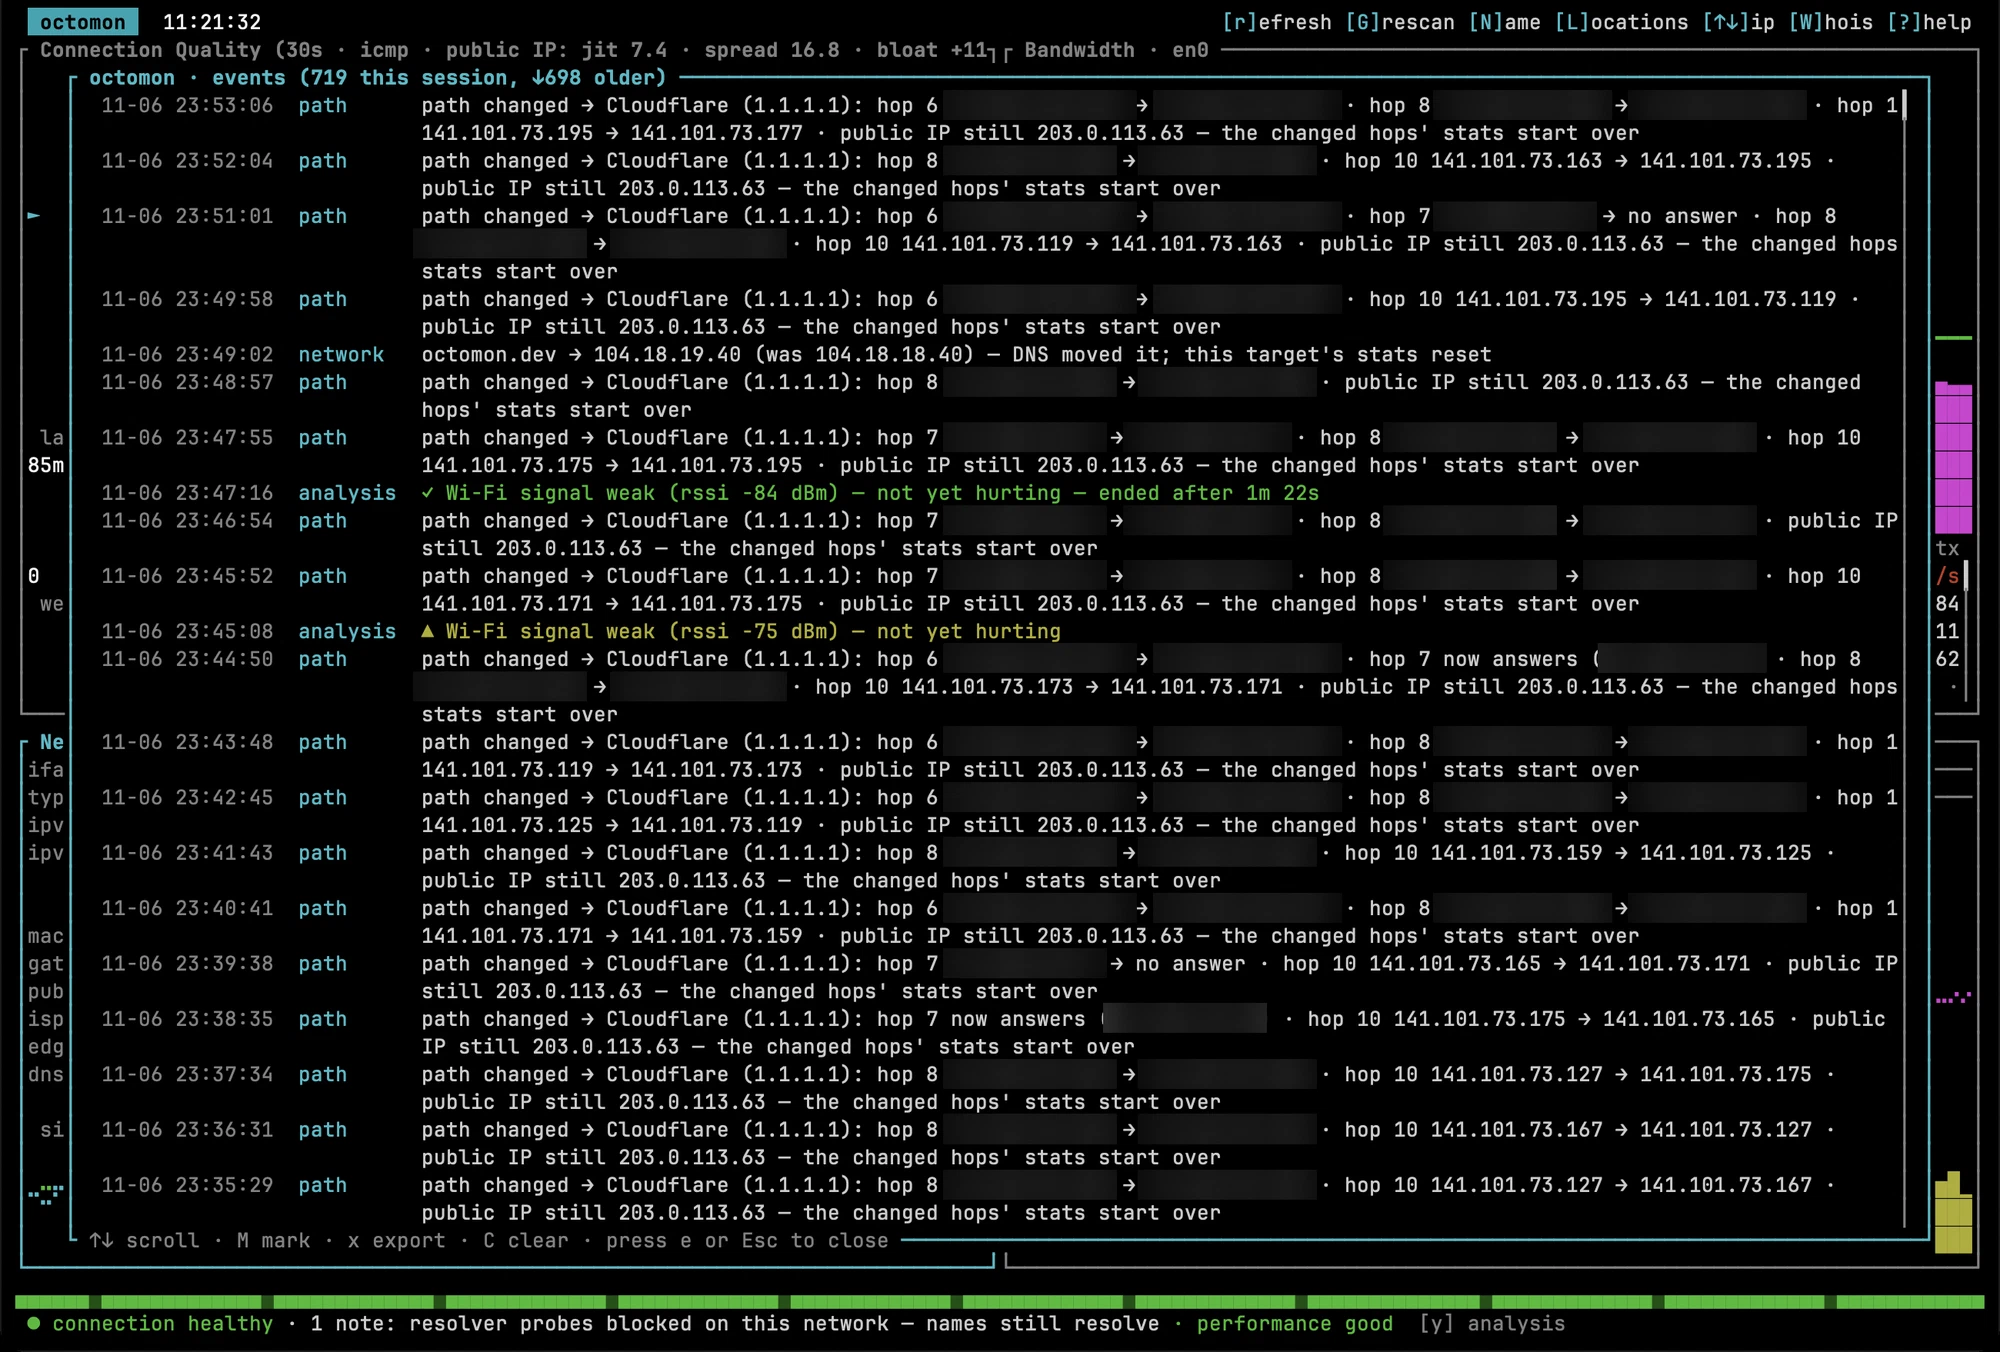
My session logged 719 events, and nearly all of them were the same one. About once a minute, octomon reports that the path to 1.1.1.1 changed. 1.1.1.1 is an anycast address that every Cloudflare data center announces, and Comcast and Cloudflare spread traffic over several equal cost paths on the way to the nearest one, so successive traceroutes land on different routers. Each change resets that hop’s stats and takes over the status line, which is where the verdict usually is. During the walk test, that ticker was all the status line ever showed. ECMP is normal, and every one of those notices pushed the verdict off the status line. Showing every parallel path through an ECMP network is the main thing viaduct does, and octomon would be easier to read if it grouped them the same way.
Getting it out of the terminal
Doctor mode
octomon --doctor runs headless for about 20 seconds, prints the analysis, this network’s normal, recent history, the measurements and the last events, and exits with 0 for healthy, 1 for problems found or 3 for couldn’t measure. The README recommends running it longer while the problem is happening, and that’s the version to attach to an ISP ticket…
octomon --observe 15m --doctorThe section of the report ISP support should read first is the baseline…
== NORMAL AT "<gateway>" (Wi-Fi (wireless)) ==
  gateway ~4ms · internet ~18ms · DNS ~28ms · rssi ~-40 dBm · speed ~654↓/40↑ Mb/s
  (56m of healthy minutes learned)
  history 7d: 1 degraded episode (14s) · mostly internet (1)
That’s a much better opening for a support call than “it’s slow sometimes.”
My 15 minutes covered the dead DNS test, Tailscale up and down, and both saturated uploads. It exited 0. The DNS outage appears only as an NTP lookup failure on the clock check, and the one episode it counted was the upload test it blamed on the internet. Read a report before you trust its exit code.
The report is redacted by default, with placeholders for the gateway, public IP and MACs and ssid=<redacted>, and the README calls it safe to paste into a forum. Mine still had the ISP hop addresses in the target list and the path change events, and the gateway’s global IPv6 in the IPv6 check line. The --json output had the same addresses, so check it before pasting. The D support bundle is unredacted by design, and the README says so.
Watch mode and alerts
The dashboard can’t help with the dropout that happens at 2 a.m. while you’re asleep. octomon --watch runs headless, prints each finding when it raises and again when it ends, and exits on Ctrl-C. --alert adds desktop notifications, --alert-cmd runs a command (the README’s example publishes to ntfy) and --alert-url posts JSON to a webhook. Alerts use the same hysteresis as the timeline, so a flapping link doesn’t produce a stream of notifications.
2026-11-06 23:55:22  ● connection healthy
2026-11-06 23:55:40  ▲ not connected — Wi-Fi is off or not associated · 4s after the link dropped · on <gateway>
2026-11-06 23:56:00  ▲ your DNS resolvers not answering — 8.8.8.8 works: switch DNS to it · 24s after the link dropped · on <gateway>
2026-11-06 23:57:30  ✓ not connected — Wi-Fi is off or not associated — ended after 1m 04s · on <gateway>
On a Mac, the first alert didn’t show up as an alert. It triggered macOS’s permission prompt for terminal-notifier, and the findings raised before I answered it never appeared. Run --alert once ahead of time and allow notifications, or your first real dropout will be spent on that prompt.
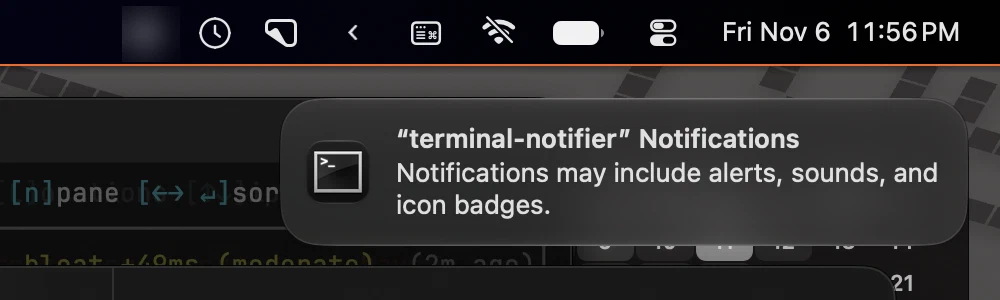
l records the session to CSV, and D writes the support bundle to your Desktop.
What it sends where
octomon only measures. It changes nothing on the network and listens on no port, but it does make outbound requests, and the README has a table of every one. Most are the probes you’d expect (the anchors, the resolvers, your OS’s captive portal check URL every 12 seconds, a public IP lookup). The only endpoint the project runs is octomon.dev/edge, hit at startup, on network changes and every 15 minutes, which reports how Cloudflare’s edge sees your connection (the PoP, your ISP’s AS and the edge’s round trip time to you) and the latest released version. The README says it stores nothing, and --no-edge or edge_check_url = "" turns it off. The author says he works at Cloudflare, which explains why the edge view is Cloudflare’s.
Its baselines, history and logs live under your home directory, readable only by you, and they contain your SSID, gateway and addresses.
Where it falls short
The project is young (the repository dates from August 2026), and I ran into a few rough edges.
- Its verdicts can be wrong in ways that matter. During my dead DNS test it said names resolved when none did, a saturated upload came out as “internet degraded beyond the gateway,” and the doctor report for both exited healthy.
- Wi-Fi trouble is underreported. A weak signal got a timeline event and nothing on the verdict line, and a channel change produced no roam finding.
- The ECMP path change ticker takes over the status line on any ISP that load balances, which is most of them.
--demoand the redacted doctor report both leave addresses that place you, the gateway’s global IPv6 in particular.- On macOS, the LAN iPerf3 test fails with a misleading error under tmux, and choosing the provider on the command line fell back to Cloudflare without saying so.
- Smaller things.
Wcan’t reach a hop,awon’t takeNAME=address, and the cursor got stuck after ad.
I tested one MacBook on one network over one night, so take that list as a sample. Every finding cites its evidence, though, and you can catch the wrong ones yourself on the ladder.
Wrap
I’m keeping it installed. The panels alone replace four or five tools I’d otherwise have open, the per network baseline is the right idea, and the LAN iPerf3 comparison answered a question about my own house in one test. My Wi-Fi delivers about 400 Mb/s of upload to a Comcast connection that carries 40, so when uploads crawl, the bottleneck is the Comcast upload.
Treat the verdict line as a strong hint, and press y before you act on it. When octomon got it wrong, the evidence on the ladder was right.
New posts in your inbox when they publish. No digest, no marketing.


Comments