Selector at NFD40: Show Your Work
Most “AI-powered observability” pitches you sit through ask you to trust the model. The dashboard says the cloud gateway is the problem, the chat box says open a ticket with your circuit provider, you’re supposed to take its word for it. Selector showed up to NFD40 with the opposite pitch. Every recommendation traces back through an explicit reasoning chain. Every chat-bot answer shows which MCP tools the agent consulted, in what order, to get there. Every conclusion is one click from the raw metric that triggered it. The product isn’t the dashboard. The product is the audit trail.
That’s a useful difference. Engineers don’t trust opaque tools, especially at 2am, especially when the tool is recommending a port flap on a production link. The way you earn trust in this category is by being inspectable, and Selector built the pipeline to support that from the ingest layer up. Reza Koohrang (head of product marketing) and Varija Sriram (founding team, now leading customer experience) walked the delegates through how it works, and the demo earned its keep.
ELT, not ETL
The architectural choice that powers everything else is unsexy, but it matters a lot. Most observability pipelines extract telemetry, transform it on the way in, and then load the cleaned-up version into the data store. ETL is the standard. Selector flipped it. They extract, load the raw data first into what they call a data hypervisor, and only then transform it. The reason: ETL strips context. By the time the data is normalized and de-duplicated, the timestamps have been collapsed, the source metadata has been thrown away, and the cross-domain alignment that made the original signal useful is gone.
For single-tool, single-domain monitoring, none of that matters. For multi-domain RCA, where you’re trying to line up a SNMP trap, a synthetic probe failure, a cloud transit gateway error, an MPLS LSP flap, and a maintenance window email on the same timeline, the preserved context is the entire ballgame. Once you’ve thrown it away, no model is going to recover it. Selector’s claim is that they can correlate across domains because the data is still wide and still tagged when it hits the correlation engine. That’s a defensible technical claim, and it explains why the rest of the architecture works the way it does.
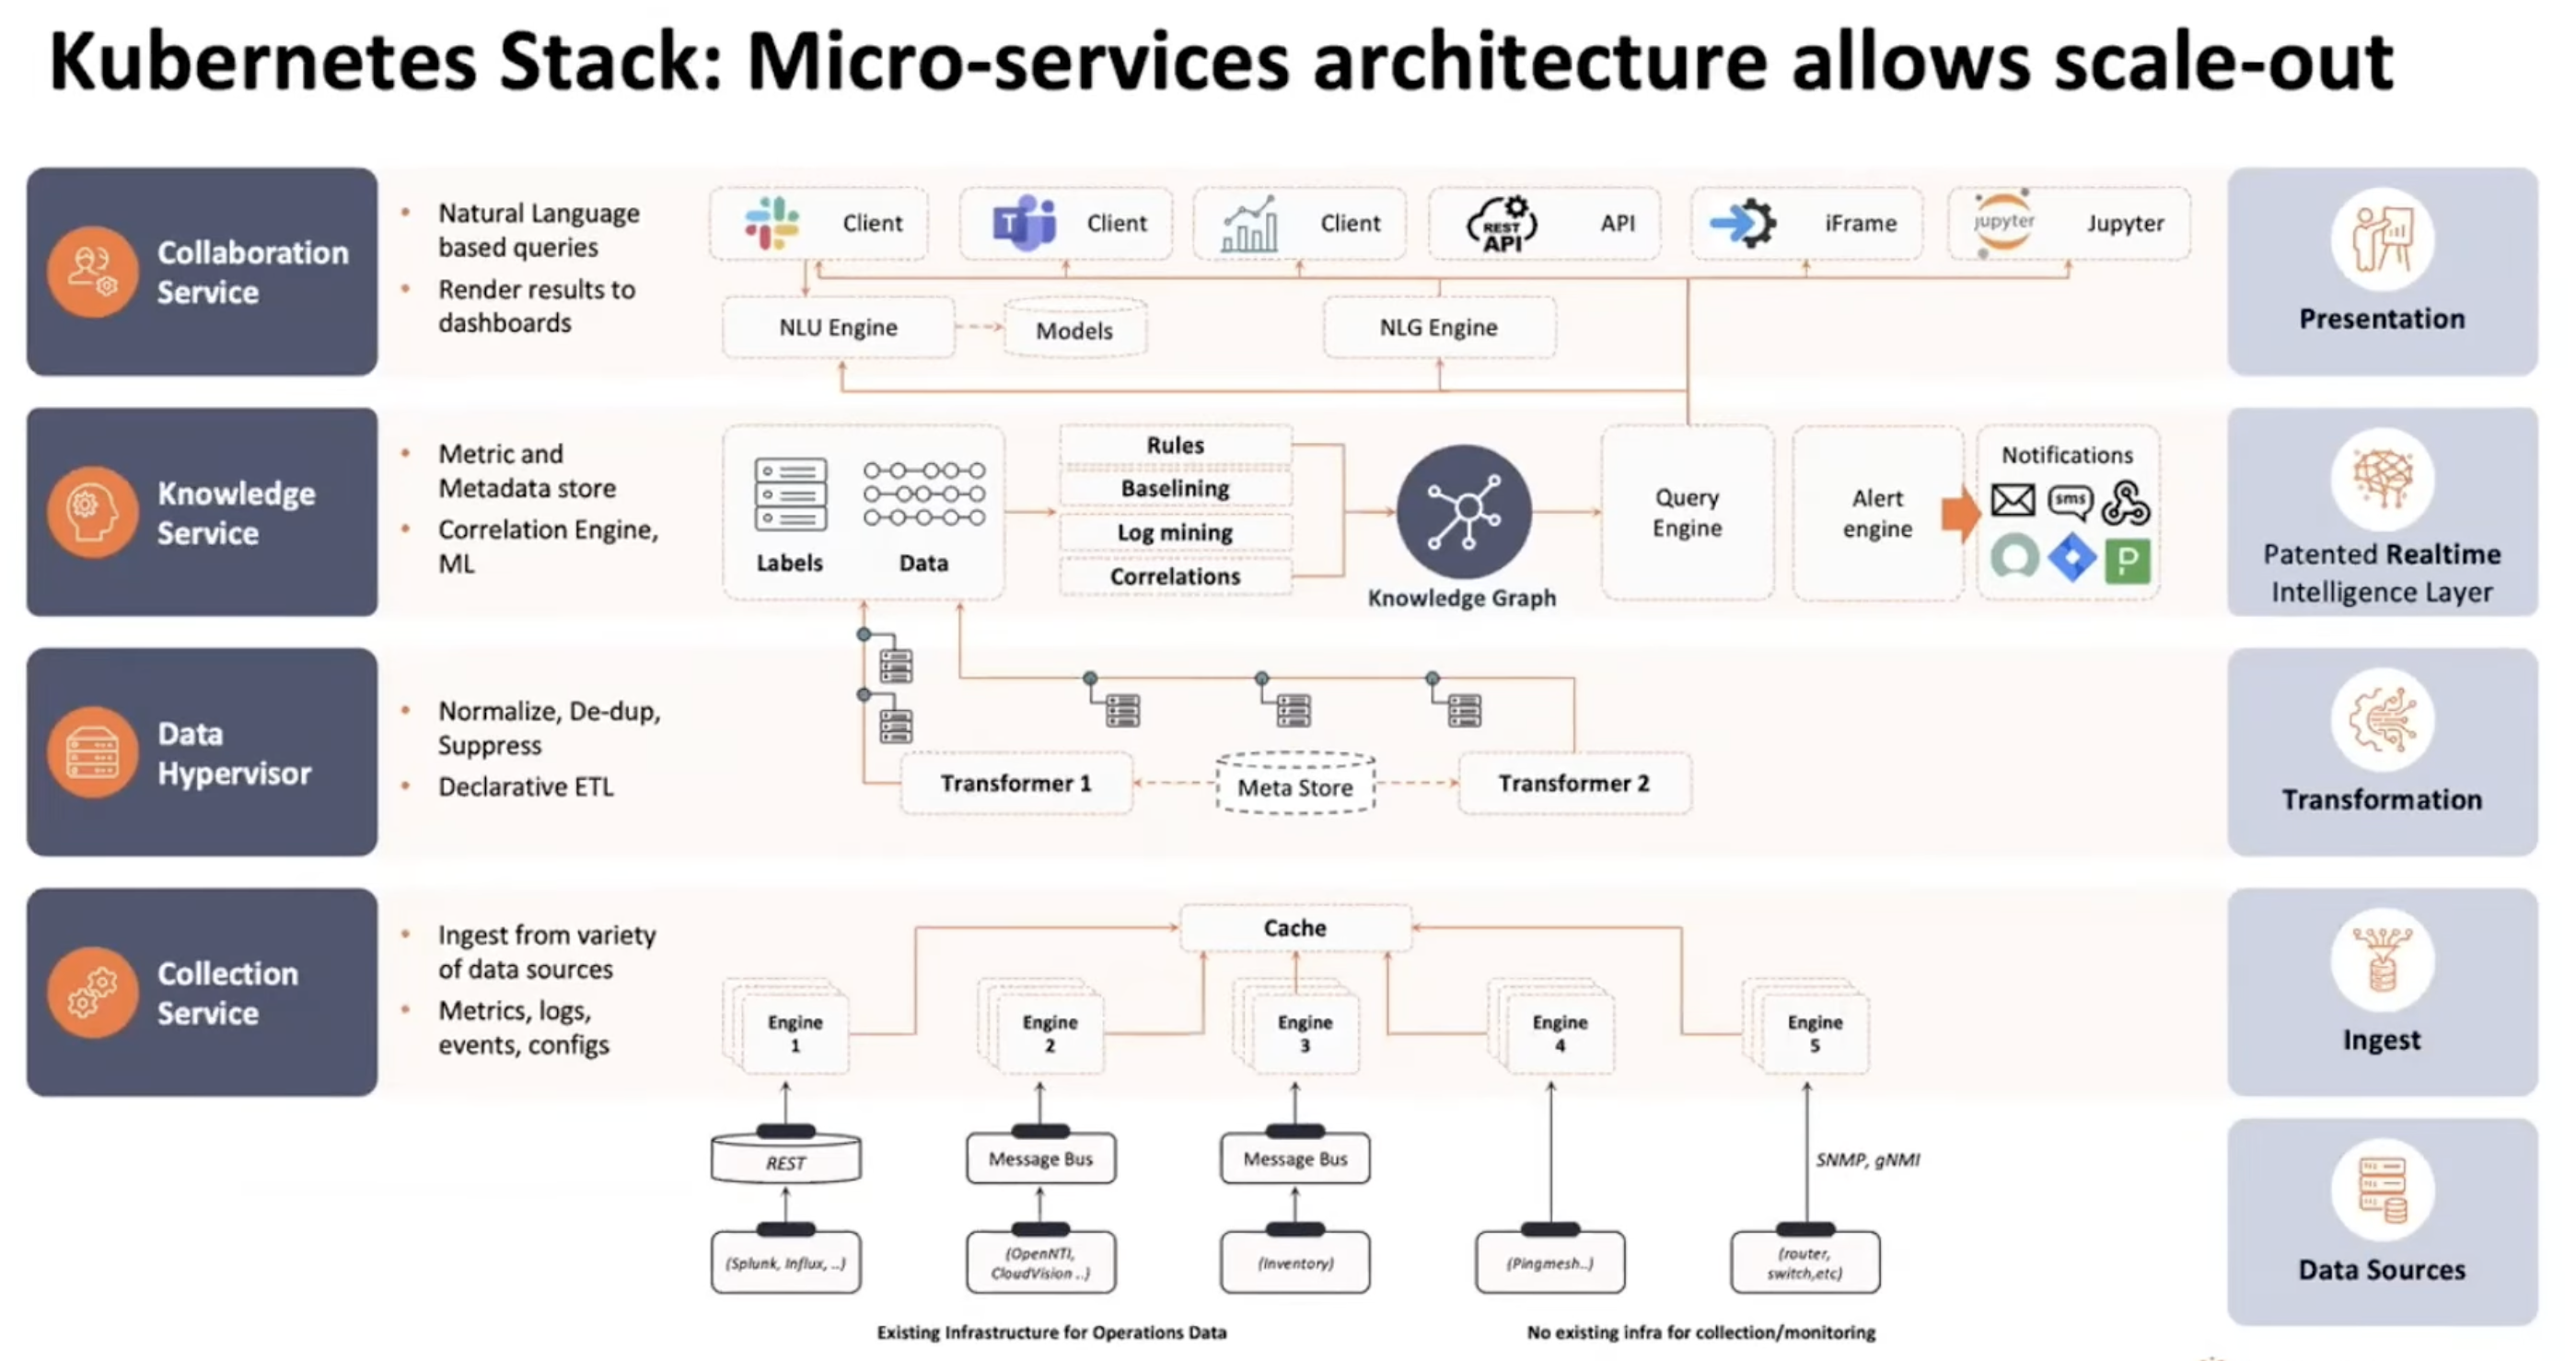
Underneath, the platform runs on Kubernetes microservices in four layers: collection (the data hypervisor pulls from over 300 telemetry sources, including raw SNMP/GNMI/syslog and also commercial tools like ThousandEyes and SolarWinds), correlation (machine learning for baselining, anomaly detection, and event grouping), causation (a separate model layer that reasons about ordering, because correlation is not causation and they take the distinction seriously), and collaboration (the formatting/routing layer that decides whether the right output goes to Slack, Teams, ServiceNow, or Jira).
Metadata is the problem
Halfway through the session Varija said the most important thing anyone said about AIOps at NFD40, and it deserves to be quoted in full:
“The richness of correlations lies in the metadata, not really in the data, not in the network indicator.”
This is the deeply true insight that most vendors in this category will not say out loud, because saying it means admitting the tool can’t save you from your own data hygiene. Your interface naming conventions, circuit IDs, link criticality flags, ServiceNow CI hygiene, and the painful project nobody wanted to do where someone reconciled the device names between netbox and your monitoring system are what determine whether multi-domain RCA actually works. The model is the easy part. The model is mostly commodity at this point. The metadata is the hard part, and most enterprises have terrible metadata.
Selector said it. They went further. When Scott Robohn pushed them on whether onboarding was turnkey or whether there’s a real engagement up front, Varija answered straight:
“Yes, we can have a straight out-of-the-box cookie-cutter solution, but that’s not how networks work. That’s not how every customer is built. So we have to understand how the devices have been named, how the interfaces have been named, how the circuits have been named.”
That’s the right answer, and the only honest one. Anyone budgeting for a product in this category needs to budget for the workshops, the naming convention review, and the inevitable discovery that a “WAN critical” link in your inventory has the IF-failure flag set to none and got missed when it dropped during the last incident. (That’s a real example Varija shared. It happens.) Selector’s customer success team treats this as engineering work, not handholding, and the success of the deployment correlates with how seriously the customer takes the up-front cleanup.
Reasoning chain is the product
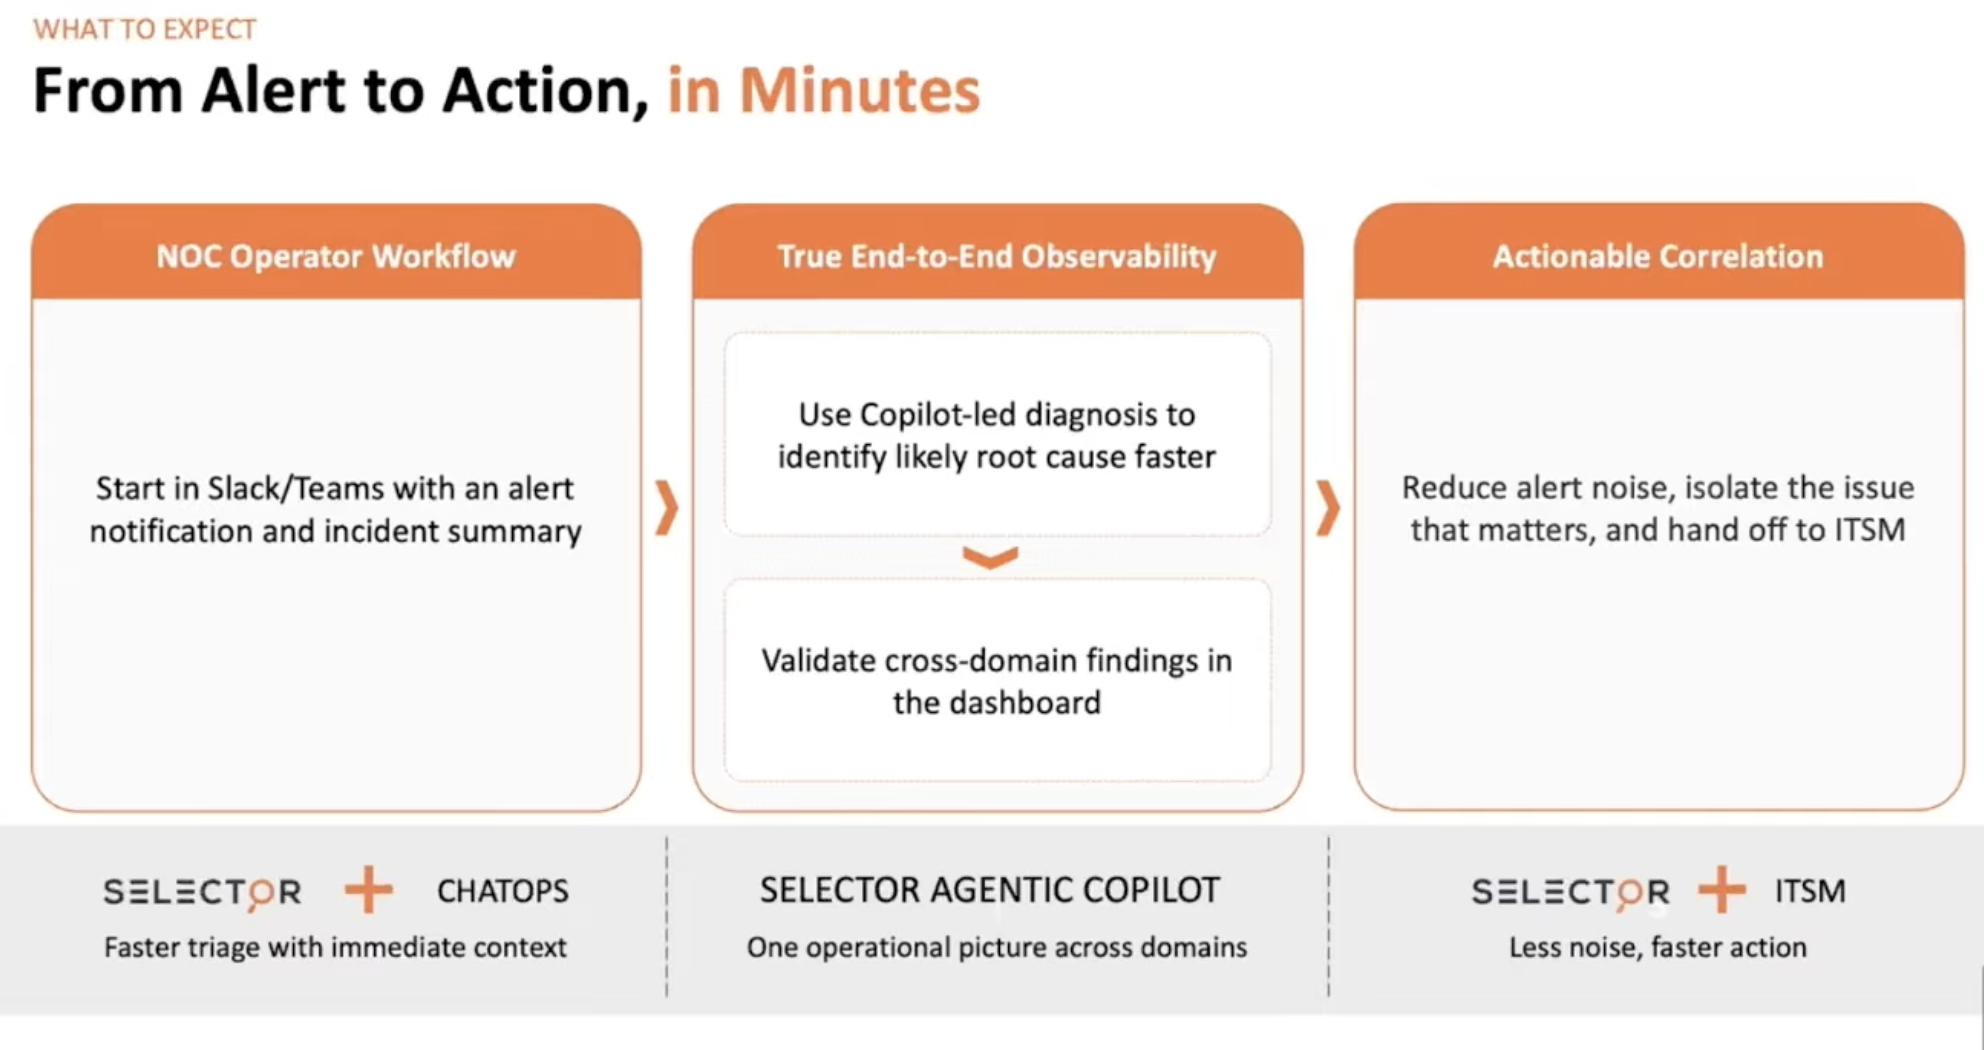
The demo flow is where the architectural argument earns its keep. Varija walked through a four-stage operator workflow that actually maps to how a NOC handles a 2am call.
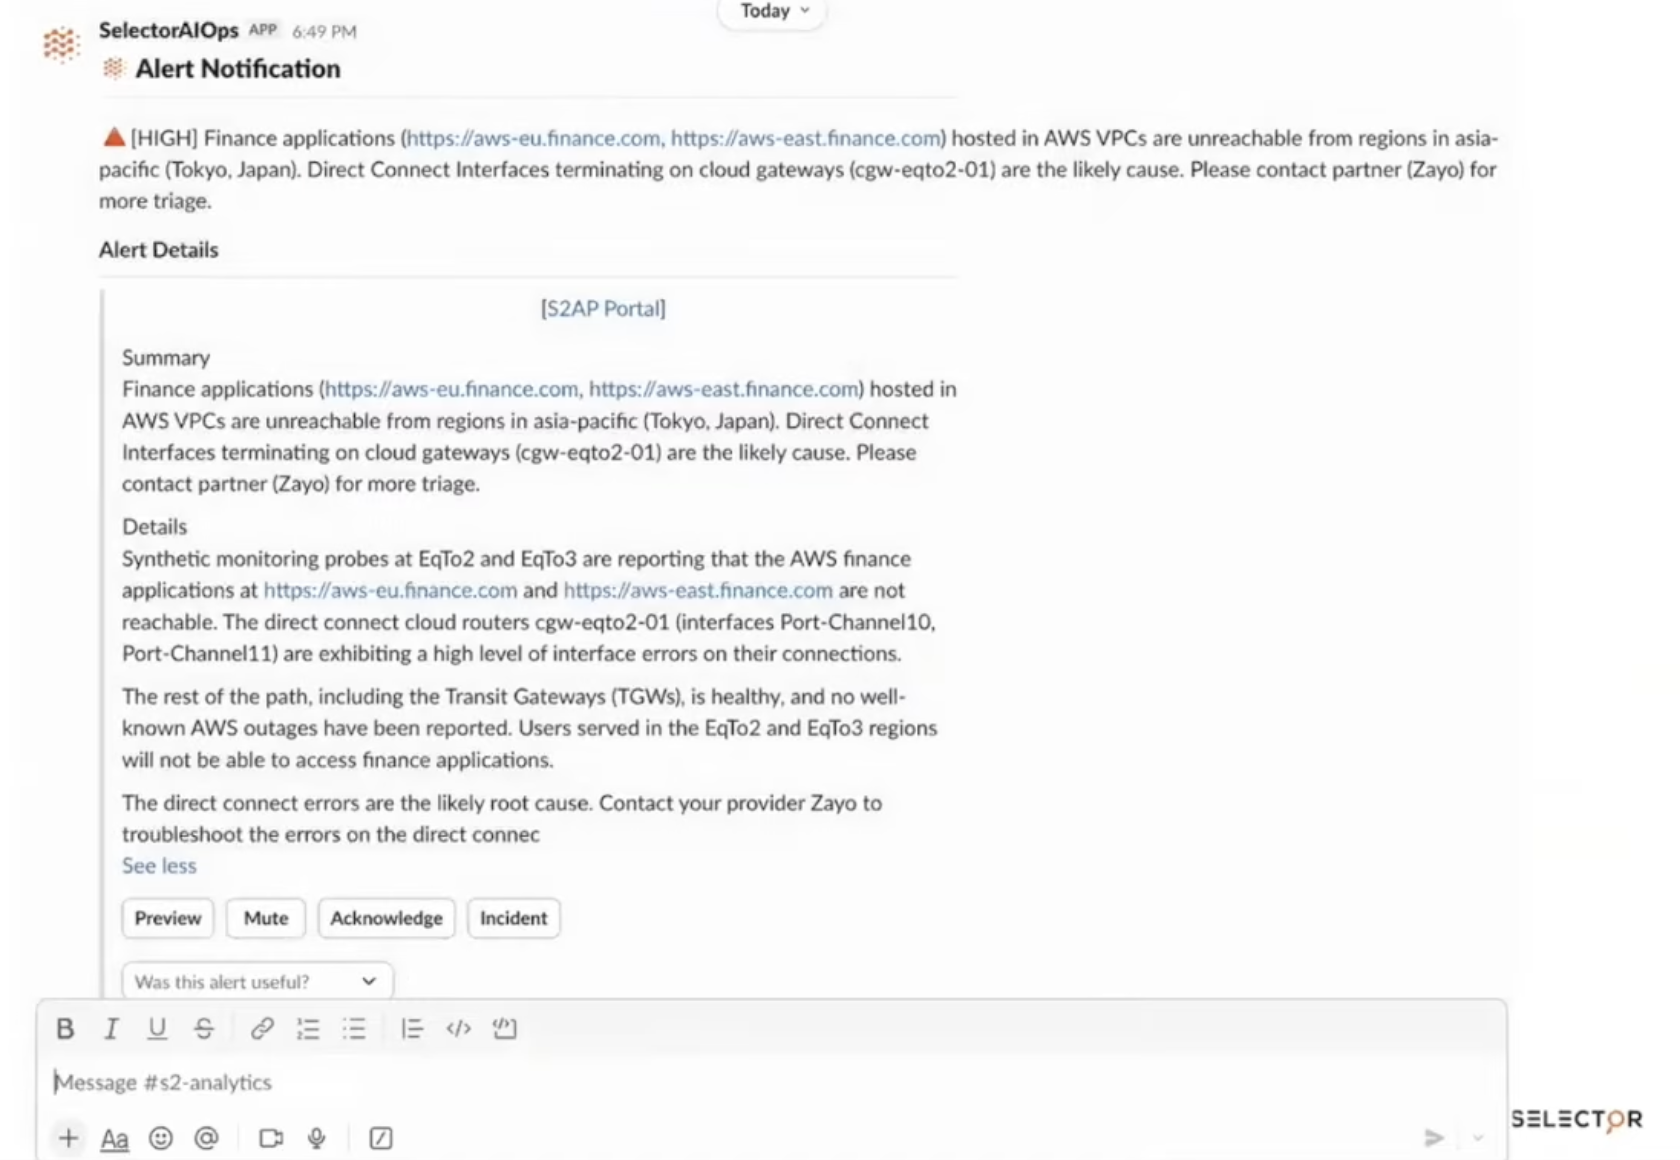
Stage one, on the phone. A Slack alert arrives saying financial applications in AWS Tokyo VPCs are unreachable. The NOC operator is doing school drop-off, not at their keyboard.
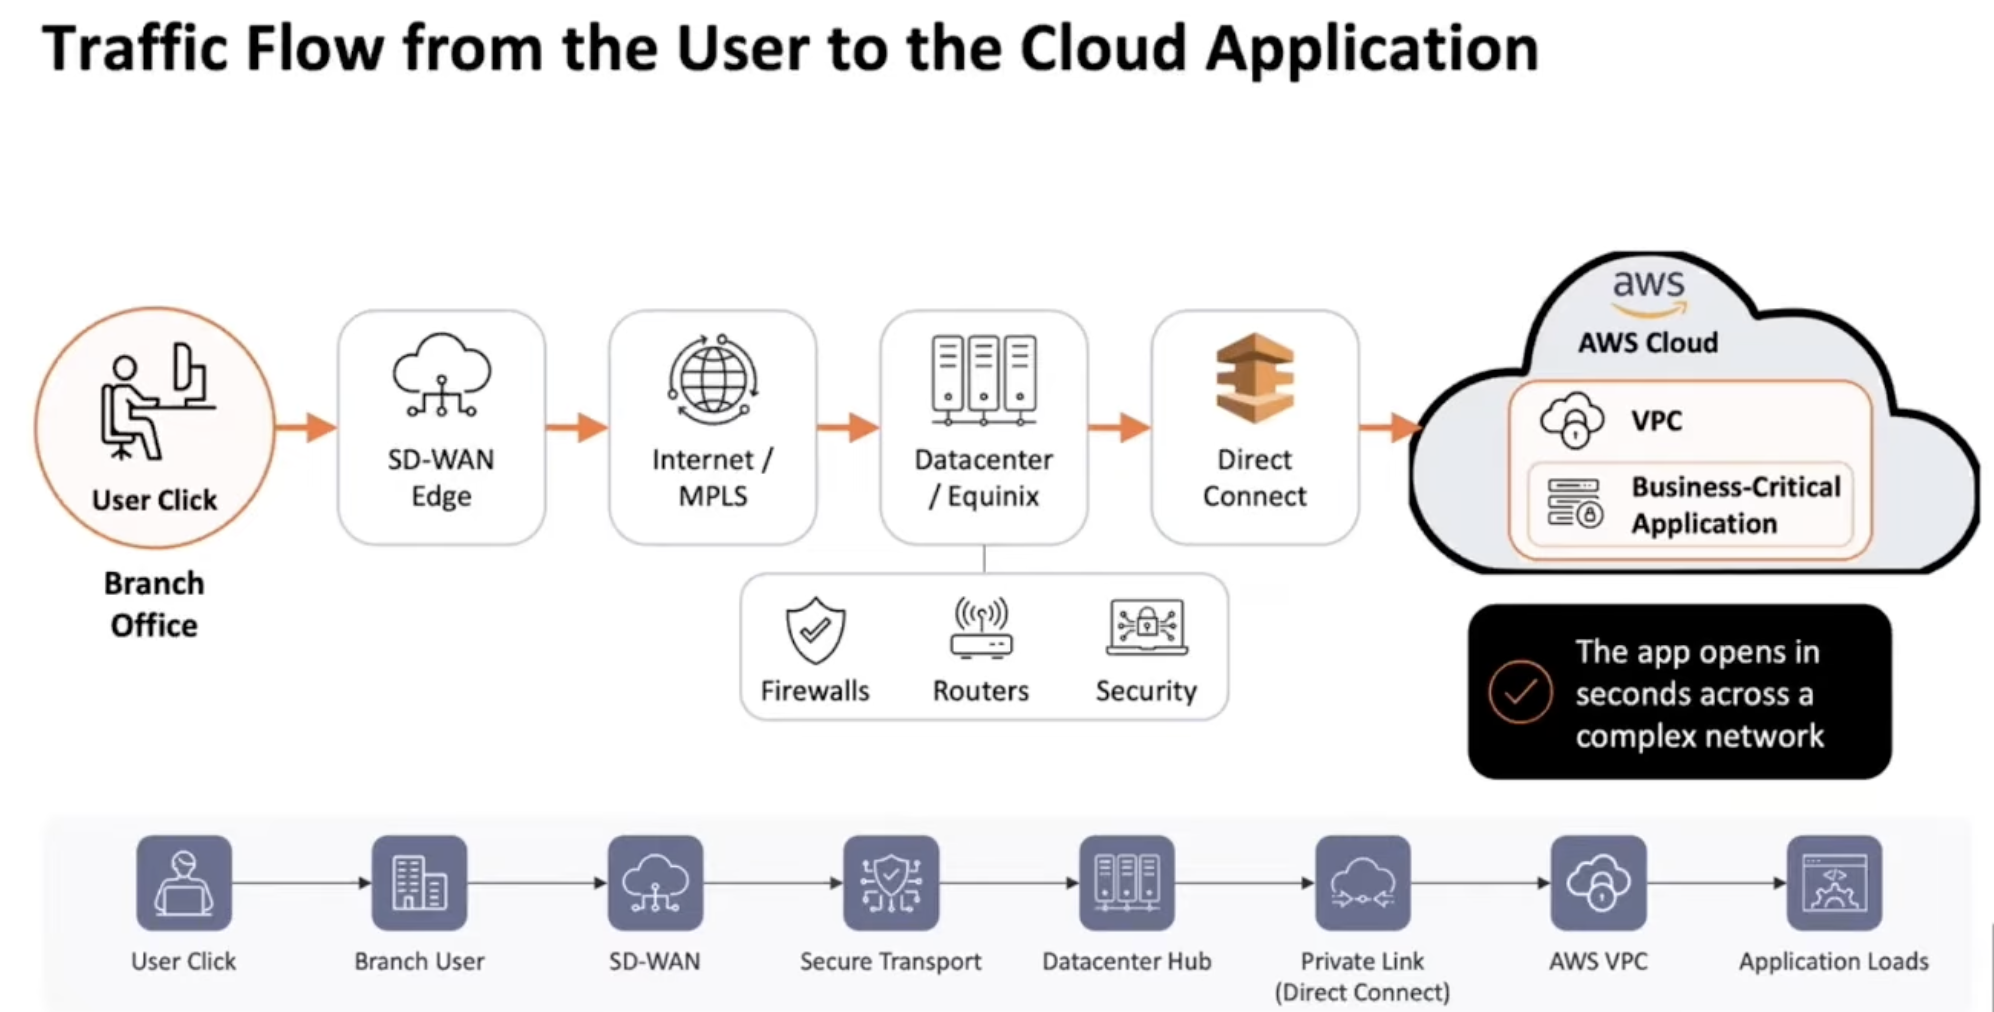
Slash-commands in Slack let them ask “show me the synthetic path to the AWS VPCs from Tokyo.” Selector returns a stitched multi-domain path trace from the synthetic probe, through the SD-WAN edge, through the security stack, through the leaf-spine, through the cloud gateway, into the AWS Direct Connect, through the transit gateway, into the VPC, to the application. The cloud gateway router is flagged red. The operator asks a follow-up: “show reachability to AWS applications across regions” and confirms the issue is localized to Tokyo, not application-wide. Triage from a phone, no laptop, in under five minutes.
Stage two, at the keyboard. Operator sits down, opens the Selector portal, clicks the copilot button. The chat opens. The operator asks “tell me more about the unreachable applications in the AWS VPCs from Tokyo as reported in the last 30 minutes.” This is where the inspectable reasoning chain shows up. The agent calls multiple MCP tools in sequence, visibly: synthetics MCP, routing MCP, provider MCP, cloud agent MCP. Each call returns context, the LLM reasons over it, and the next call is selected based on what was learned. The operator can see exactly which subsystems contributed to the answer, which is the difference between “trust me” and “here is my work.”
The final answer in the demo: physical fiber degradation on the Zayo direct-connect circuits (both 100G and 10G), with optical RX and TX failures detected, plus port-channel interface errors on the cloud gateway routers downstream. Recommended action plan: contact Zayo with the specific circuit IDs, internal hardware cleanup on the cloud gateway, and a traffic engineering review because the primary path failure didn’t auto-fail to the secondary the way it should have.
Stage three, the dashboard. The copilot conclusions link directly to the underlying widgets. Optical RX/TX is one click away. Interface error counters are one click away. The maintenance-window calendar (Selector ingests vendor maintenance emails and parses them into a calendar that participates in the correlation engine) is one click away. Every conclusion is verifiable against the raw metric. This is the part that makes the tool defensible to a senior engineer who got burned by the last AIOps product.
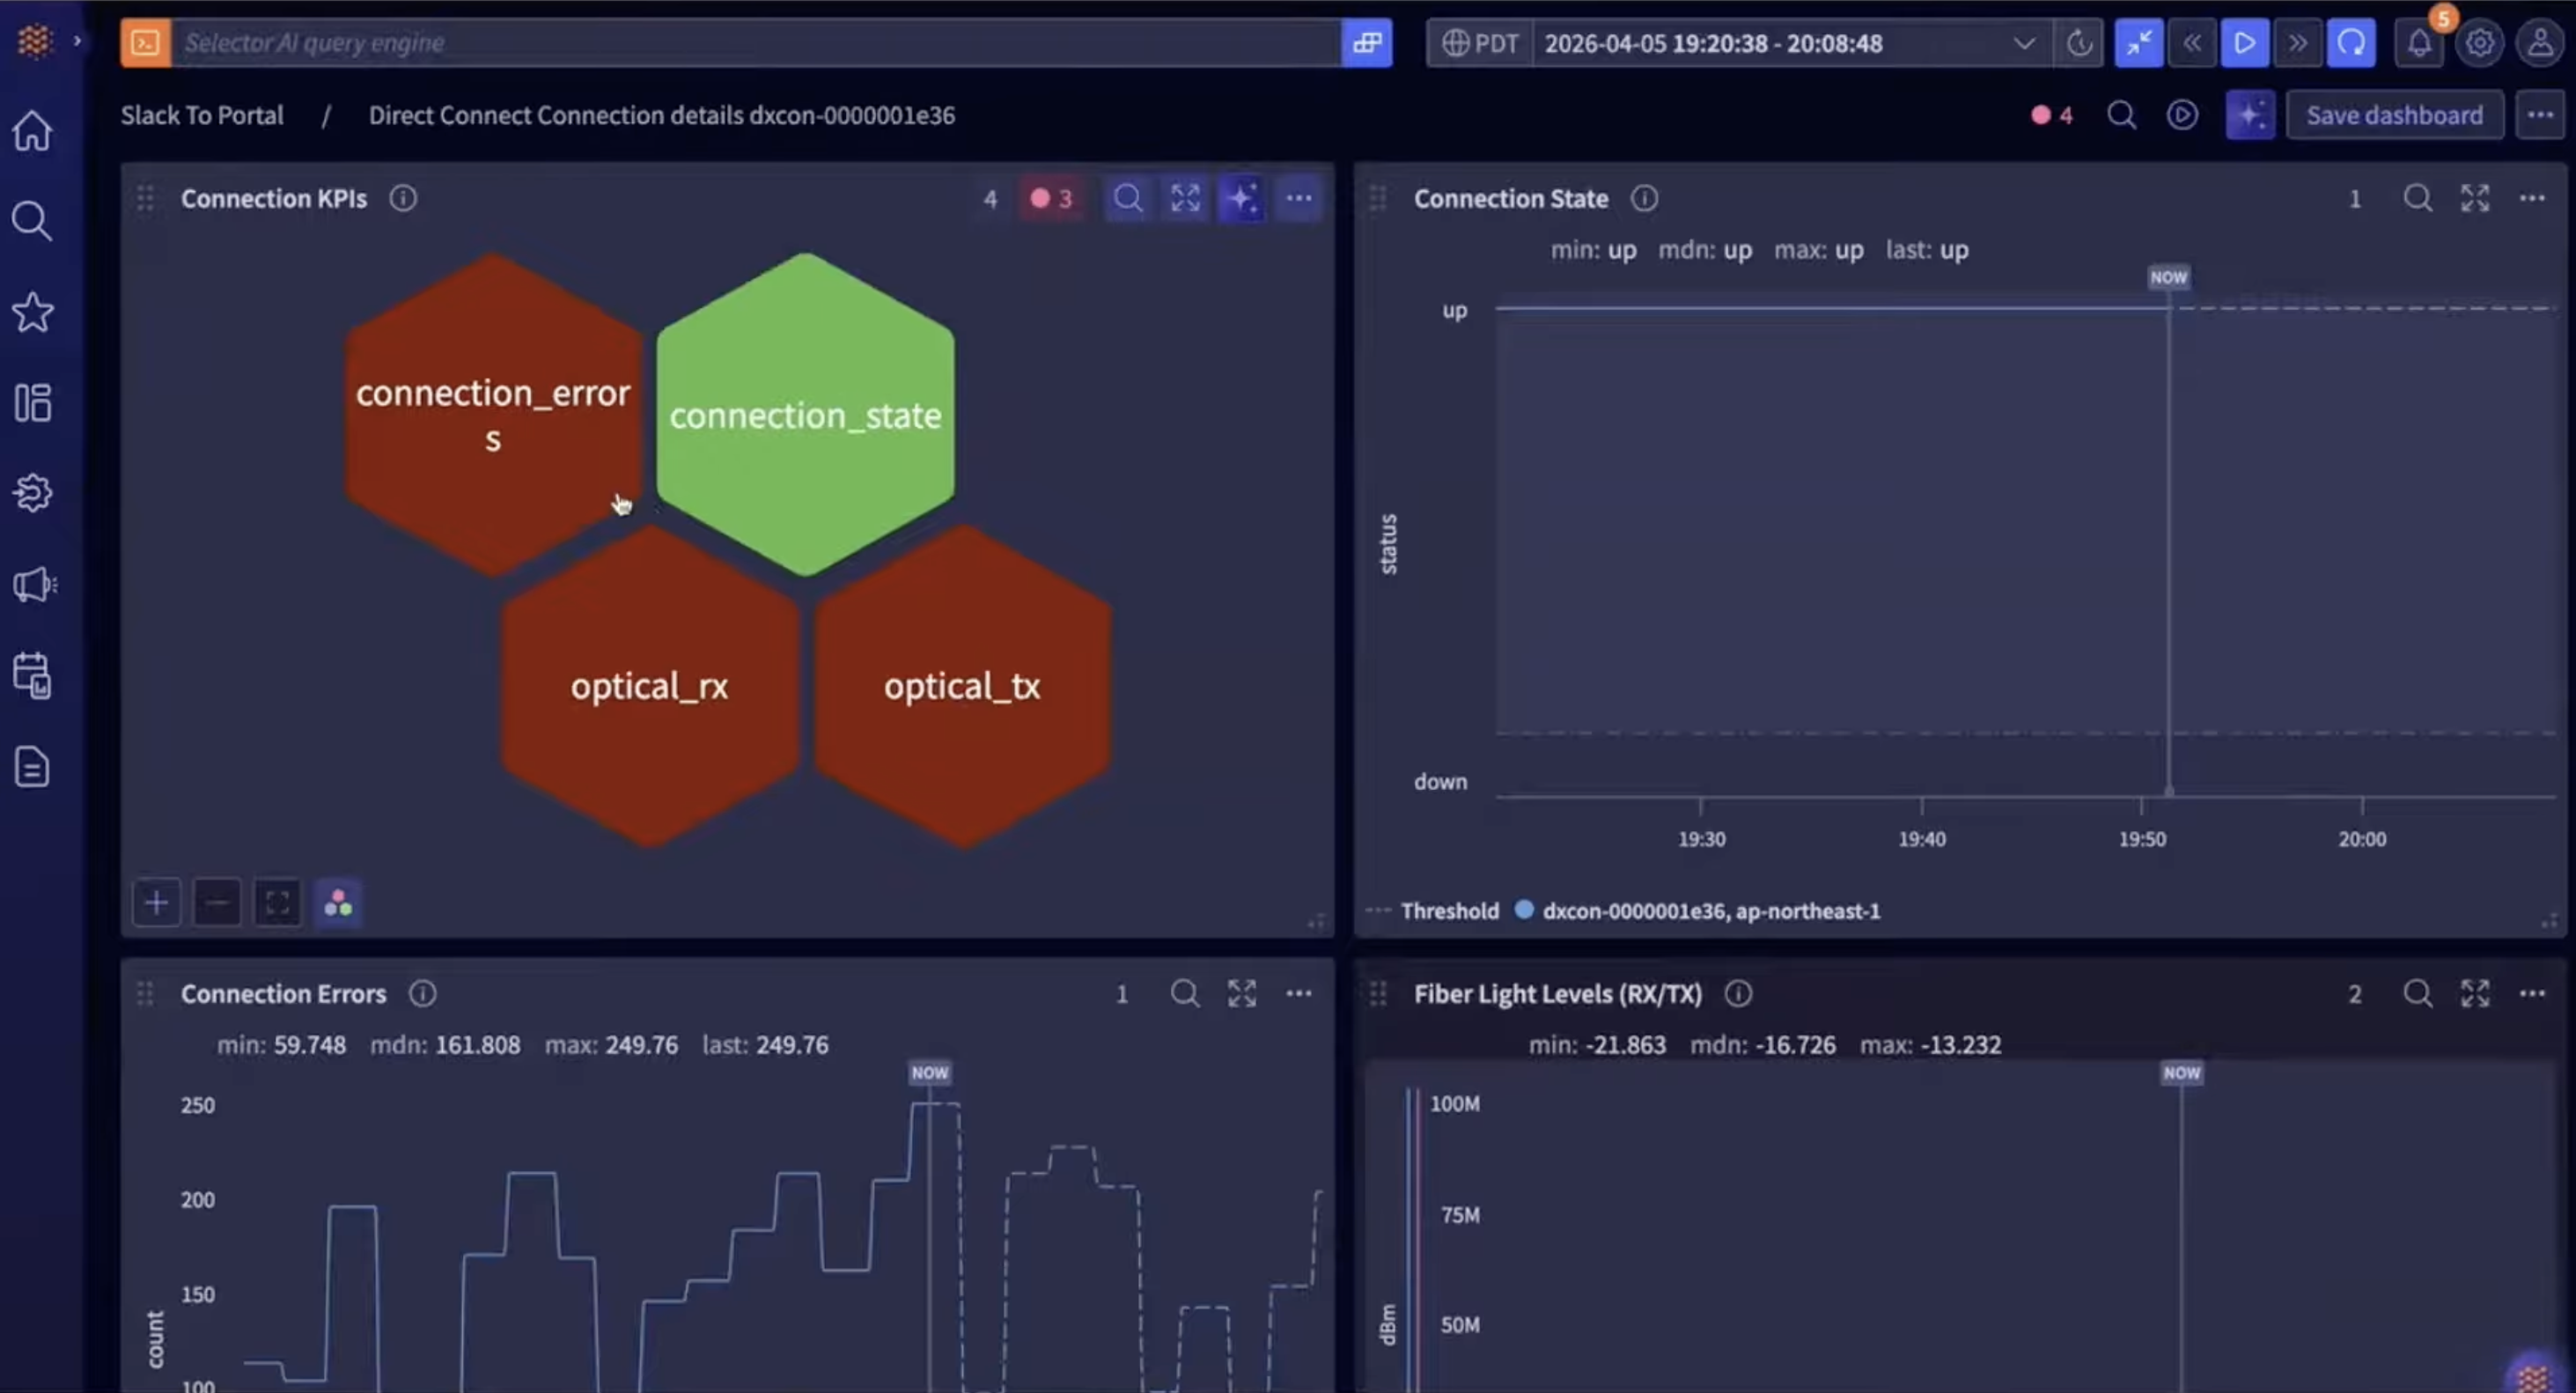
Stage four, action. Bidirectional Jira/ServiceNow integration auto-creates the ticket with the same description, applications, and details. Notes flow both directions. Past incidents are de-duplicated and the new occurrence is appended to the existing ticket history. Closed-loop automation can trigger non-intrusive runbooks (ping diagnostics, SNMP walks) automatically, and intrusive ones (port flap, optical cleanup workflow) on operator approval. Per-persona RBAC on the action triggers is on the roadmap, not shipping.
That whole flow is the right shape for an operator-facing tool. Triage from anywhere, deep investigation when you sit down, raw-metric verification when you don’t trust the conclusion, action when you’re ready. Most vendors build one of those four stages well and hope you don’t notice the others…
Synthetic data as a first-class signal
The other architectural piece worth flagging is that Selector generates its own signal, not just ingests. Their S2 agent runs in four flavors: active mesh probes between sites for latency and packet-loss measurement, passive ICMP liveness checks across the device fleet (they have deployments doing 30,000 to 40,000 devices), URL monitoring with HTTP/HTTPS status codes and page load time, and user-defined multi-step probes for multi-page application flows where the failure only shows up on page two or three after a login. All four feed the correlation engine alongside the SNMP, syslog, and flow data.
Most observability tools either correlate alerts (reactive) or run synthetic checks (proactive) but treat them as separate products. Selector treats them as one signal stream. When Phil Gervasi asked about anomaly detection on baselined metrics, Varija confirmed they’re using six-standard-deviation auto-baselining for things like latency where “normal” varies by site, and hard thresholds for things like CPU where 80% is always concerning. Configurable per metric family. That’s the right answer.
Honest moments worth quoting
A few exchanges stood out because the company didn’t oversell.
“We have not gotten to a token exhaustion state yet.” When asked about token cost management for the agentic copilot calling Gemini across multiple MCP tools, Varija was straight: it’s early, they don’t have a perfect answer, expect it to be a focus area next year. That’s the right kind of admission for a product in active rollout.
“For most of our customers we are using Gemini.” They lead with Gemini as the foundation model. Some customers BYO their own private LLM. Worth saying out loud because the LLM choice has implications for latency, cost, and data sovereignty, and “we use Gemini” is a different operational story from “we run a local model on your hardware.”
“The user being tied to the conversation is on the roadmap.” Today the chat context is per-window, not per-user. Tom Hollingsworth made the sharpest point of the session in this thread: persistent user persona memory shouldn’t just help troubleshooting, it should be a training tool. The LLM could skip the entry-level questions for a senior engineer and start juniors at the L1 checks. That’s an insight worth crediting and a roadmap item worth tracking.
“There will be a WAN critical link which has IF failures set to none.” Varija used this as a real example of why the up-front workshop matters. Selector caught a major outage because the link was flagged critical in inventory, but the SNMP polling for that interface had IF-failure alarms disabled by mistake. Until the customer fixed the configuration, no tool was going to detect that failure. The metadata-hygiene insight applies to your monitoring tool’s own configuration, not just your network’s.
Who Selector is built for
Selector is for organizations running multi-domain operations across networking, cloud, storage, and application layers, with at least a few thousand devices and enough alert volume that humans cannot triage manually. They cite Fortune 1000 enterprise customers and large service providers as the typical fit. If you’re running a 3-rack data center with 50 devices and one observability tool, you are not the customer.
If you are in the multi-domain category, the differentiated thing about Selector is the inspectable reasoning chain. The architecture (ELT pipeline, agentic MCP-based copilot, four-stage operator workflow) supports that claim, and the honest answers about metadata hygiene and customer onboarding suggest the team understands what actually goes wrong in production. The dependencies (Gemini by default, customer-provided compute for synthetic agents, SaaS-first deployment with on-prem collectors, persona RBAC still on the roadmap) are real and worth knowing about before you sign anything.
Trust in this category is earned by being inspectable. Selector’s pitch is that they’re built that way from the ingest layer up. The demo showed it working. Worth a look if you’ve been burned by tools that hide their work behind a pretty dashboard.
Disclosure: I attended Networking Field Day 40 as a delegate. My travel and accommodations were covered, but I was not compensated for this post and the opinions are my own. For more, please read my full Tech Field Day disclaimer.
Links & Resources
Other Delegate Posts
- NFD40: Selector.AI Finds the Problem - Peter Welcher, LinkedIn
- SelectorAI: One Tool to Rule Them All - Peter Welcher, LinkedIn
- Making Metadata Matter with Selector AI - Tom Hollingsworth, Techstrong
Get the rest of Networking Field Day 40 in your inbox.